Chapter 3 Policy Influence: Do Public Pressure Campaigns Influence Bureaucratic Policymaking?
Abstract
I investigate whether public pressure campaigns increase lobbying success in agency rulemaking using a mix of hand-coding and computational text analysis methods. To measure lobbying success, I develop computational methods to identify lobbying coalitions and hand-code a random sample of rules for whether each coalition got the policy outcome it sought. I then assess potential mechanisms by which mass public engagement may affect policy. Each mechanism involves a distinct type of information revealed to decisionmakers. Of primary interest is the extent to which public pressure campaigns affect agency decisionmakers directly or indirectly through their effects on elected officials’ oversight behaviors. I find that members of Congress are more likely to engage in rulemaking when advocacy groups mobilize public pressure and that lobbying coalitions are more successful when they mobilize more legislators. However, I find little evidence that public pressure campaigns directly increase lobbying success. This may be because decisions to mobilize public pressure are correlated with anticipated lobbying success. Lobbying coalitions are more successful when they mobilize more members of Congress, but legislators disproportionately align with private interest (e.g., business-led) coalitions, not the public interest coalitions that run most public pressure campaigns.
3.1 Introduction
There is little overlap between scholarship on interest group influence in bureaucratic policymaking and scholarship on advocacy group’s public pressure campaigns. Studies and models of interest group lobbying in the bureaucracy rarely include public pressure as a lobbying tactic (see S. W. Yackee 2019 for a recent review). Conversely, studies of organized public pressure and contentious politics rarely include specific policy outcomes as their dependent variable (Andrews and Edwards 2004; Burnstein 2019). When they do, they tend to focus on landmark legislation (e.g., Gillion 2013) or a few illustrative cases (J. J. Mansbridge 1992; Rochon and Mazmanian 1993; S. W. Yackee 2009).
It is plausible that thousands of people engaging may alter the politics of bureaucratic policymaking (Coglianese 2001), but this hypothesis remains largely untested. The limited prior work on public participation in bureaucratic policymaking has focused more on the quality than the impact of public input. Studies on small samples of policies suggest that large-scale public participation may prolong the policy process (Shapiro 2008). Larger studies suggest that form letters are less influential than sophisticated comments (Steven J. Balla et al. 2020). Scholars have yet to test whether the scale of public pressure supporting a coalition increases coalition-level lobbying success.
To address this gap, I assess the relationship between the number of people mobilized by public pressure campaigns and whether the coalition sponsoring each campaign achieved its policy goals. Building on the theory of the role of public pressure in bureaucratic policymaking outlined in Chapter 2, I argue that the unit of analysis must be the lobbying coalition, not individual comments and form letters. Rather than comparing the quality and impact of form letters to technical comments written by lawyers, I argue that we must attribute both to the broader lobbying efforts they support. Lobbying, I argue, is about both the technical details of policy and politics. In theory, technical information and political information may both affect policy.
Because scholarship on bureaucratic policymaking has focused on the power of technical information, where insider lobbying is most likely to matter (Wagner 2010) and where outside strategies are least likely to matter, political scientists have largely overlooked public pressure campaigns as a lobbying tactic. To date, there has been much less theorizing about the power of political information in bureaucratic policymaking. In this chapter, I theorize and test several mechanisms by which public input may affect bureaucratic policymaking. Each mechanism involves a distinct type of information that pressure campaigns may relay to policymakers.
To test whether public pressure campaigns increase lobbying success in agency rulemaking, I the impact of public comments on agency rules using a mix of hand-coding and computational text analysis methods. I develop computational methods to identify lobbying coalitions and hand-code a random sample of rules for whether each coalition got the policy outcome it sought. I then assess potential mechanisms by which mass public engagement may affect policy. Of primary interest is the extent to which public pressure campaigns affect agency decisionmakers directly or indirectly through their effects on elected officials’ oversight behaviors. I test whether legislators are more likely to engage in rulemaking when advocacy groups mobilize public pressure. I then examine congressional oversight as a mediator for the policy effects of public pressure campaigns.
I find little evidence that public pressure campaigns increase lobbying success. Lobbying coalitions are more successful when they mobilize more members of Congress, but legislators disproportionately align with private interest (e.g., business-led) coalitions, not the public interest coalitions that run most public pressure campaigns.
Following this introduction, Section 3.2 reviews past work and builds a theory of how public pressure may affect policy outcomes. Section 3.3.1 introduces a novel dataset developed through an iterative process of computational methods and hand-coding. Section 3.3.2 develops models that use these data to assess the relationship between public pressure and policy outcomes, both directly and indirectly, through mobilizing elected officials. Section 3.4 presents the results and Section 3.5 concludes the chapter.
Foundational scholarship on both American politics (T. Lowi 1969) and bureaucracy (Wilson 1989) emphasize the critical role of interest groups. In particular, scholars highlight the differences between groups that represent broad and narrow interests. Lowi’s famous policy typology distinguishes the politics of policymaking by what type of interests a policy affects. Similarly, Wilson’s typology of government agencies is fundamentally linked to the kinds of interest group pressures agencies may face. For example, a “client-agency”— formed to support a sector or activity—will deal with narrow private interest groups that have incentives and power to influence the agency’s policy decisions at every turn:
A client agency will have to struggle mightily to avoid having its work influenced by the single, organized group with which it must deal on a daily basis. Many do not succeed; a few do not even try (Wilson 1989, 79).
Agencies created to serve broader interests emerge out of broad public interest groups organizing but face persistent pressure from the narrow private interests these agencies attempt to regulate. An entrepreneurial agency may even struggle to persist if the broad-based public interest groups that support it lose power:
An agency created as the result of entrepreneurial politics is in a precarious position: since it was born out of an attack on the interests it is now supposed to regulate, its employees must worry that the social movements that created their tasks may desert the fledgling agency because of shifting interests or waning passions, leaving it to confront a hostile interest group alone and unprotected (Wilson 1989, 80).
Policy outcomes depend on the distribution of power among interest groups (Dür and De Bièvre 2007).
Whether representing broad or narrow interests, many interest groups exist primarily to influence policy (Baumgartner and Leech 1998; Leech 2010), and policymakers face strong interest-group demands (S. W. Yackee 2006). Businesses and their associations are the most active and influential lobbying organizations, especially in bureaucratic policymaking (J. W. Yackee and Yackee 2006). In particular, businesses are better positioned to provide evidence and make technical arguments (Jewell and Bero, n.d.). Organizations with the resources to lobby with multiple tactics across multiple venues over time are more likely to influence bureaucratic policymaking (S. W. Yackee 2015a). However, public interest advocacy organizations also have well-documented effects on legislative policymaking (Grossmann 2012).
With renewed attention to the role of advocacy groups in policymaking (Hojnacki et al. 2012; Grossmann 2012), the dichotomy between accountability to political principals and “capture” is being replaced by studies that focus on numerous mechanisms of interest group influence in policymaking. Measuring lobbying success is a major challenge for studies of interest group influence (Mahoney 2007a; J. W. Yackee and Yackee 2006; Rashin 2017). As Potter (2017a) put it, “discerning influence from any kind of lobbying is a notoriously elusive exercise because of the difficulty in knowing the counterfactual scenario.” Despite this renewed attention to interest groups and their effect on the bureaucracy, scholars have paid relatively little attention to outside lobbying strategies.
One reason that scholars of bureaucratic policymaking have largely ignored outside lobbying strategies like public pressure campaigns is the strong normative belief among many legal scholars that bureaucratic policymaking should rest on rational analysis rather than politics. Dmitry Epstein, Heidt, and Farina (2014, 4) dismiss mass comments as “effectively, votes rather than informational or analytical contributions. Rulemaking agencies are legally required to make policy decisions based on fact-based, reasoned analysis rather than majority sentiment; hence, even hundreds of thousands of such comments have little value in the rulemaking process.” Notably, the ACUS draft recommendations on “Mass and Fake Comments in Agency Rulemaking” suggests that “effective comments” give “reasons rather than just reactions” (ACUS 2018, 33). If true, most public reactions to proposed rules such as those expressed in mass comments would have no effect on rulemaking.
Skepticism about bureaucratic policymaking as a venue for collective action has led most scholars to dismiss public pressure campaigns as epiphenomenal to technocratic rationality and bargaining among agency officials, their political principals, and interest groups. Indeed, almost all empirical studies of rulemaking discard unsophisticated comments from ordinary people. A comprehensive review of scholarship on the politics of rulemaking (S. W. Yackee 2019) finds skepticism about the influence of citizen comments, but no studies analyzing public pressure campaigns as a lobbying tactic:
Kerwin and Furlong (2011) point out that a citizen must know not only that a regulation is being formulated but also how and when to participate. This is a high bar for most Americans. Second, to be influential during rulemaking, commenters may require resources and technical expertise. As Dmitry Epstein, Heidt, and Farina (2014) suggest, agency rule-writers—who are often chosen because of their technical or policy-specific expertise—privilege the type of data-driven arguments and reasoning that are not common to citizen comments. (p. 10)
For any particular lay commenter, this conclusion seems inescapable; individuals acting alone are unlikely to affect policy. While “ordinary” members of the public may occasionally provide novel and useful technical information to expert bureaucrats, such sophisticated means of influencing policy are out of reach for the vast majority of people. Thus, to investigate the potential role of ordinary people in bureaucratic politics I look elsewhere—not because ordinary people never provide novel and useful technical information, but because this is not how most people attempt to influence policy, nor, I argue, how we should expect ordinary people to have influence.
Most public comments do not provide useful technical information or suggest specific edits to policy texts like the interest group comments that have thus far captured the attention of political scientists. If they add information to rulemaking, it is a different, more political flavor of information. Thus, I investigate the value of ordinary people’s comments not individually but as a result of public pressure campaigns.
3.2.1 What We Know About the Effects of Mass Comment Campaigns
Two published studies have looked at the relationship between public pressure campaigns and policy outcomes in agency rulemaking. Shapiro (2008) investigates whether the number of public comments relates to the time between the draft and final rule. With only nine observations, this study was unable to uncover general patterns. Steven J. Balla et al. (2020) study 22 Environmental Protection Agency Rules and identify 1,049 “campaigns” targeting these rules—here, a “campaign” means a batch of form-letter comments associated with an organization, which they code as “regulated” (e.g., a power plant) or a “regulatory beneficiary” (e.g., environmental groups). They find that the agency was more likely to reference the more sophisticated comments that groups submit than form letters. They also find that several types of observed policy changes (e.g., changes in the number of regulated entities and the date that the rule goes into effect) better align with changes requested by sophisticated interest group comments than those found in form letters. They conclude:
These patterns suggest that legal imperatives trump political considerations in conditioning agency responsiveness, given that mass comment campaigns – relative to other comments – generally contain little “relevant matter. (Steven J. Balla et al. 2020, 1)
While Steven J. Balla et al. (2020) recognize the political nature of public pressure campaigns, they follow many of the administrative law scholars in comparing form letters to sophisticated technical comments. For example, their model compares the number of times the agency references the lengthy comments drafted by the Sierra Club’s Legal Team to the number of times the agency references the short form letters drafted by the Sierra Club’s Digital Team. In contrast, I argue that we should understand the form letters as a tactic aimed at gaining power for coalitions and organizations that also submit sophisticated technical comments. Public pressure is not an alternative to sophisticated lobbying efforts; it is a resource that works in tandem.
3.2.2 Public Support: a Political Resource
An organization’s ability to expand the scope of conflict by mobilizing a large number of people can be a valuable political resource (Elmer E. Schattschneider 1975), and public pressure campaigns expand the scope of conflict (Potter 2017a). Public engagement and mobilization can thus be a tactic to gain power. Scholars who understand mobilization as a lobbying tactic (S. R. Furlong 1997; Kerwin and Furlong 2011) have focused on how organizations mobilize their membership. I expand on this understanding of mobilization as a lobbying tactic to include the mobilizing of broader audiences—the “attentive public” (Key 1961) or “issue public” (Converse 1964).
Here I build on three insights, the first two of which I introduce in Chapter 2 and only summarize here briefly. First, S. R. Furlong (1997) and Kerwin and Furlong (2011) identify mobilization as a tactic. The organizations that they surveyed reported that forming coalitions and mobilizing large numbers of people are among the most effective lobbying tactics. Organizations surveyed by English (2019a) also reported being organized into coalitions. The theory and empirical strategies below build on work showing that the size of lobbying coalitions (the number of organizations lobbying together) predicts lobbying success (J. W. Yackee and Yackee 2006; McKay and Yackee 2007; Nelson and Yackee 2012; M. Dwidar 2022).
Second, I argue that the same mechanism by which scholars understand coalition size to matter should apply to public pressure campaigns, as well. As a tactic, public pressure campaigns generate political support and information about the coalition that mobilized it. Nelson and Yackee (2012) identify political information as a potentially influential result of lobbying by different business coalitions. While they focus on mobilizing experts, I argue that Nelson and Yackee (2012) describe a dynamic that can be extended to mass commenting. Concerning political information, this logic extends to non-experts. The number and distribution of ordinary supporters may matter because it suggests a public consensus. Instead of bolstering scientific claims, a perceived public consensus bolsters political claims.
Third, S. R. Furlong (1998), S. W. Yackee (2006), and others distinguish between direct and indirect forms of interest-group influence in rulemaking. This distinction is especially important for political information, which may be most influential through indirect channels (e.g., by mobilizing elected officials to contact the agency). In short, to understand how groups lobby in rulemaking, we must understand mass mobilization as a tactic aimed at providing political information that may have direct and indirect impacts on policymaking.
The direct path to influence involves persuading agency officials. As discussed in Section 2.2, most scholars have emphasized mass comments’ lack of useful technical information, but a few scholars have raised the role of mass comment campaigns in creating political information. Cuéllar (2005) calls on agency officials to pay more attention to ordinary peoples’ expressions of preference and Rauch (2016) suggests reforms to the public comment process to include opinion polls. I build from a similar intuition that mass comment campaigns currently function like a poll or petition, capturing the intensity of preferences among the attentive public—i.e., how many people are willing to take the time to engage. Self-selection may not be ideal for representation, but opt-in participation—whether voting, attending a hearing, or writing a comment—may often be one of the few heuristics decisionmakers have about public preferences.
The indirect pathway involves affecting the behavior of elected officials, which may then affect the agency’s policy responses. Campaigns inform agency officials about the distribution and intensity of opinions that are often latent, not fully formed, or too nuanced to estimate a priori. Many questions that arise in rulemaking lack analogous public opinion polling questions, making mass commenting a unique source of political information. As with public opinion on any specific policy issue, most members of the public and their elected representatives may only learn about the issue and take a position as a result of a public pressure campaign (Hutchings 2003). If a lobbying strategist believes the attentive public is on their side, they may attempt to reveal this political information to policymakers by launching a public pressure campaign.
Potter (2017a) identifies the power of mass comment campaigns to “expand the scope of conflict” and “give leaders the cover they need to pursue policies that face political opposition” as two distinct mechanisms by which campaigns may affect policy outcomes. In contrast, I consider expanding the scope of the conflict to be a broader category that encompasses the second. Expanding the scope of conflict may both directly persuade agency officials and indirectly affect policy decisions by reshaping the strategic policymaking environment (e.g., giving cover from political opposition in Congress).
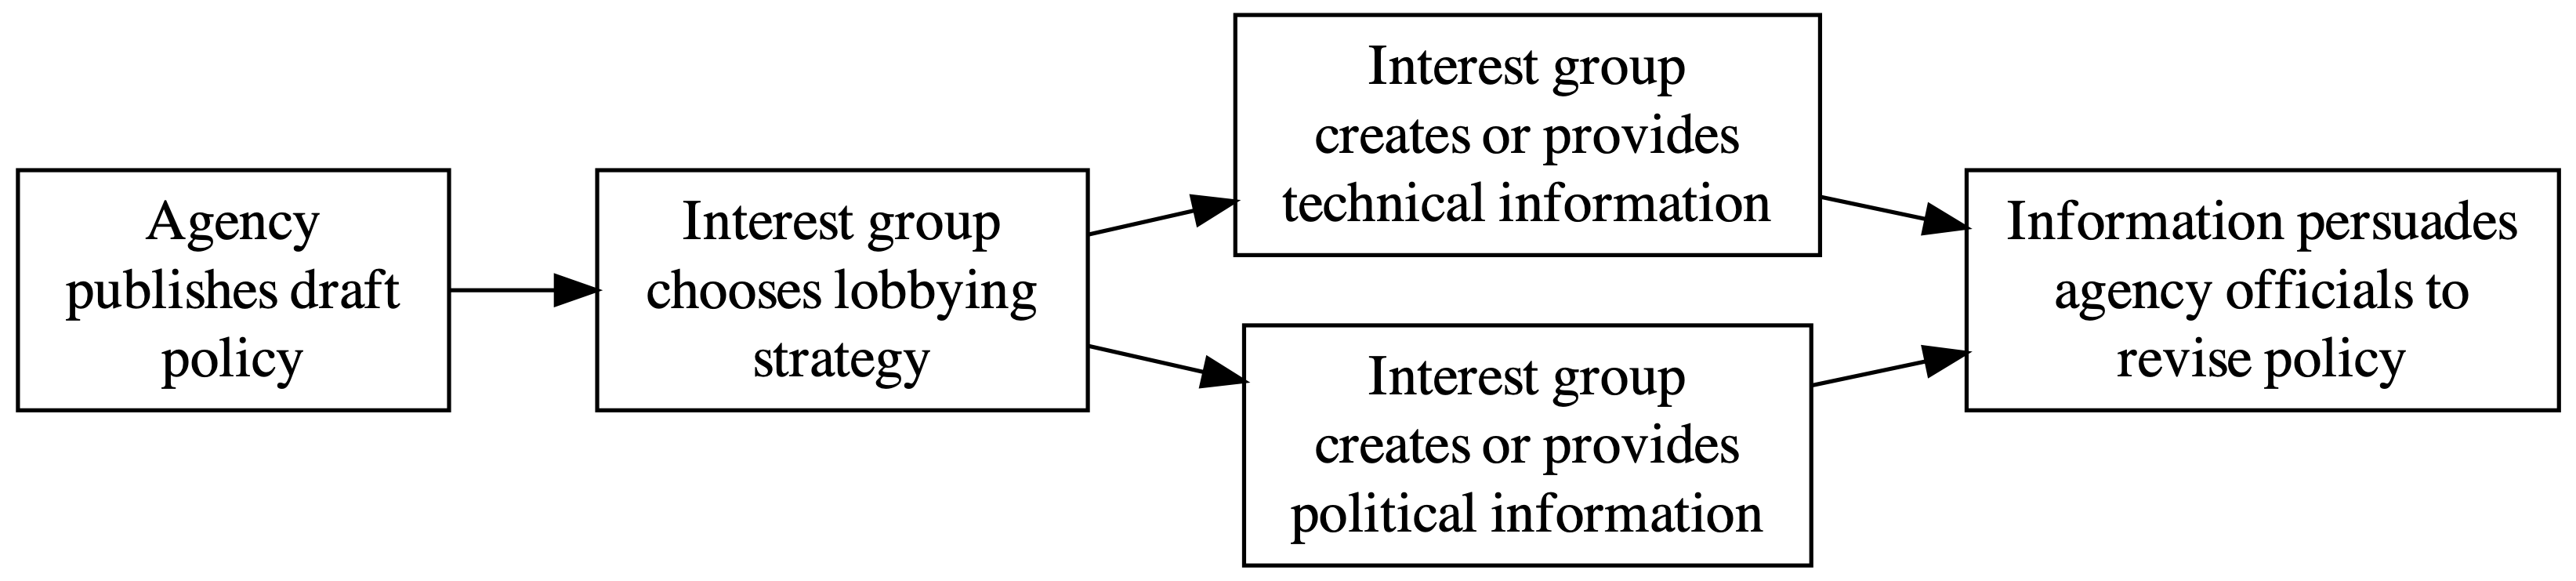
Figure 3.1: Direct Effects of Political Information: Incorporating Political Information into Models of Bureaucratic Policymaking
Figure 3.1 (Figure 2.3 from Chapter 2) shows how political information about the attentive public fits into theories of bureaucratic policymaking. This figure shows two direct pathways by which a lobbying organization may influence policymakers. One lobbying strategy (often the only strategy in models of lobbying the bureaucracy) is for an organization to provide technical or legal information such as data, analyses, or legal arguments. There are many reasons to believe that providing technical information is a powerful strategy for organized groups to affect policymaking, especially in the bureaucracy. Bureaucrats may be particularly likely to be persuaded by technical information that leads them to update their beliefs about the policy language that would best achieve desired policy outcomes.
In addition to providing technical information through sophisticated comments, an organization or coalition of organizations may provide political information by mobilizing supporters. The size of a coalition’s investment in mobilizing supporters and the response it generates offer political information to policymakers, including information about the resources a coalition is willing to invest, the intensity of sentiments among the attentive public, and the potential for conflict to spread. The first two types signal two kinds of intensity or resolve. Both show the mobilizers’ willingness to commit resources to the lobbying effort, which often extends beyond a mass comment campaign. Second, costly actions (even fairly low-cost behaviors like signing a petition) show the intensity of opinions among the mobilized segment of the public (Dunleavy 1991). The number of people engaged by a campaign is not strictly proportional to an organization’s investment. The more people care, the less it costs to mobilize them and thus the higher the response to a campaign. This kind of political information may persuade policymakers to adjust their policy positions.
Inferences about the extent to which lobbying caused any changes (or lack of changes) between the draft and final rule are challenging, but studies of policy generally use observational data and thus require some assumptions linking policy success (a lobbying group getting their desired result) and policy influence (causing a policy outcome). Groups invest in providing information “relevant” to technocratic policymakers, and the policy response is assumed to be a function of this information.
The causal process visualized in Figure 3.1 may only operate under certain conditions. The influence of political information on policy (the arrow between “Interest group creates or provides political information” and “Information persuades agency officials to revise policy”) depends on the institutional processes by which agency officials receive and interpret information. That is, agency contexts may condition the extent to which officials may be persuaded. Agency officials often reject the notion that public pressure should inform their decisions. For example, in response to several public pressure campaigns, the Consumer Financial Protection Bureau wrote:
A rough estimate of pro and con submissions by individuals may provide insight as to public interest in a topic and to individual consumer experiences. However, under both the Administrative Procedure Act (APA) and the Dodd-Frank Act, the Bureau must base its determinations in rulemaking on the facts and the law in the rulemaking record as a whole. (CFPB-2020-14935/p-134)
Despite statements like this, there are plausible mechanisms by which political information may reshape the politics of rulemaking. Public pressure may bring in additional and more political agency personnel, which in turn can affect the policy process (C. Carrigan and Mills 2019). Likewise, it may attract the attention of members of Congress who then raise procedural concerns (Lowande and Potter 2021).
We may expect to observe mass mobilization influencing a particular policy only if the mobilization effort was aimed at influencing that policy, rather than using the public comment period to build organizational membership or power more generally (see Chapter 2).
3.2.3 Hypotheses about the Relationship Between Mass Engagement and Lobbying Success
Hypothesis 3.1 sets out the most direct implication of my theory. If public pressure campaigns generate political information that affects policy, lobbying coalitions that use pressure campaigns should win more often. Rather than compare form letters to technical comments, I attributed form letters to the broader lobbying efforts they support. Thus, assessing Hypothesis 3.1 requires comparing lobbying success when coalitions do and do not opt to use a pressure campaign to support their more technical lobbying effort. The power of a pressure campaign in my theory rests in its ability to make a coalition more successful in achieving its policy goals that are more precisely articulated in technical comments. Lobbying success is thus the extent to which a coalition got the specific policy changes it sought.
If Hypothesis 3.1 is correct, lobbying coalitions with public pressure campaigns should have higher average levels of lobbying success than coalitions that do not.
Building on the intuitions about the reasons that organizations launch pressure campaigns set out in 2.2, the effect of pressure campaigns may depend on the reason for mobilizing. Public interest groups more often have incentives to mobilize for reasons other than influencing policy than private interest groups. As I show in 2.4, this means that campaigns are overwhelmingly dominated by public interest groups. In contrast, private interest groups such as businesses only have incentives to mobilize public pressure when they expect it to affect policy. This dynamic creates a selection effect whereby pressure campaigns by private interest groups should be more likely to influence policy because they are more concentrated on policies that can be influenced.
Finally, we can think about lobbying success at the organizational level. It would be inappropriate to compare lobbying success across organizations, many of which may be in the same coalition. However, because many organizations lobby across many rules, we can assess leverage variation in the same organization’s lobbying success. If Hypothesis 3.3 is correct, using pressure campaigns should be positively correlated with lobbying success within organizations as they lobby across multiple rules in coalitions that do and do not use pressure campaigns.
Understanding civic participation in rulemaking as a mediated process aimed at generating political information suggests a different role for mass comment campaigns than that assumed by existing (albeit limited) literature on this topic. While my hypotheses address a similar question (do mass comments matter?), my theory implies a different way of answering this question. Rather than an alternative to lobbying strategies that rely on more “sophisticated”—e.g., technical—information, my framework posits mass comment campaigns (at least those aimed at influencing policy) as a part of a broader strategy that includes providing both technical and political information to decisionmakers.
The next subsection restates the theory in the language of formal models of rulemaking.
3.2.4 Incorporating Political Information into Formal Models of Rulemaking
Formally, my argument that lobbying strategies like pressure campaigns aim to create political information requires several crucial amendments to existing information-based models of rulemaking. Specifically, I argue that information about the political context in which policymakers operate can persuade them to make policy changes. Allowing policymakers to be persuaded in such a way allows public pressure campaigns to be incorporated into these models. Doing so also resolves some puzzling results of models that assume “fixed” political preferences. Allowing policymakers’ political priorities to be affected by political pressure from commenters creates uncertainties about policymakers’ political positions and incentives for lobbying organizations to attempt to affect them by providing political information.
My aim here is not to test the implications of formal models. Rather, I briefly review the necessary modifications to one leading formal model in order to illustrate the importance of political information to theories of policymaking. The statistical tests of my theory that I propose in Section 3.3.2 require that policymakers can be persuaded by political information. My aim in this subsection is to illustrate the implications of my argument and results for formal theory.
In the most sophisticated model of notice-and-comment rulemaking to date, B. Libgober (2018) posits a utility function for policymaker \(G\) as shown in Equation (3.1).
\[\begin{equation} u_G(x_f) = \alpha_0 x_f^2 + \sum_{i=1}^N \alpha_i u_i (x_f) \tag{3.1} \end{equation}\]
where \(x_f\) is the spatial location of the final policy, \(u_i\) is the preference of “potential commenter” \(i\), and \(\alpha\) is a vector of “allocational bias”—i.e., how much the agency decisionmakers care about their preferences \(\alpha_0\) relative to accommodating the preferences of others \(\alpha_{i=1:N}\). Bureaucrats balance their own understanding of their mission against their desire to be responsive. In Libgober’s model, \(\alpha_{1:N}\) is a fixed “taste” for responsiveness to each member of society (i.e., each potential commenter), so policy decisions simply depend on their answer to the question “what do people want?”
Incorporating insight about the power of technical information, we might interpret \(\alpha_0\) (the policymakers’ understanding of their own preferences) to be affected by technical information. Including political information in this model requires two additional parameters related to a second question: “Why would agency officials care?”
First, like other lobbying strategies, public attention and pressure may shift the strategic environment, leading policymakers to strategically shift their allocation in favor of some groups and away from others. Let this strategic shift in allocation be a vector \(\alpha_s\). For example, interest groups may mobilize elected officials to support their lobbying efforts. If these elected officials can sanction or reward agency officials or veto the agency’s policy, their involvement may reshape agency officials’ strategic calculations. Agency officials may then strategically adjust their policy. For each commenter, \(i\), \(\alpha_{si}\) is the policymakers’ strategic shift in their desire to allocate policy benefits to group \(i\) as a result of changes in the broader decision environment, such as increased attention from members of Congress. For example, if a member of Congress writes to the agency in support of commenter \(i\)’s position, \(\alpha_{si}\) may increase, whereas if a member of Congress writes to the agency in opposition to commenter \(i\), \(\alpha_{si}\) may decrease.
Second, campaigns may directly persuade agency officials to adjust their allocational bias, for example, by supporting claims about the number of people an organization represents or the intensity or legitimacy of their policy demands. Let this direct shift in allocations be \(\alpha_d\). This parameter captures persuasion on normative grounds and beliefs about which segments of society (i.e., which potential commenters) deserve the benefits of government policy or should be responsible for bearing the costs. Policies allocate costs and benefits across groups. If an organization makes a persuasive argument for distributional justice or shows that it represents a large segment of the public, officials may update their beliefs and biases about how to allocate costs and benefits. For each commenter, \(i\), \(\alpha_{di}\) is the shift in the policymaker’s desire to allocate benefits to \(i\) as a result of being directly persuaded.
Let policymakers’ original, immutable taste now be \(\alpha_t\). Having decomposed the policymaker’s allocative bias into three parts (their fixed tastes \(\alpha_t\), shifting strategic environment \(\alpha_s\), and potential to be convinced \(\alpha_d\)), the policymaker’s utility function is now Equation (3.2).
\[\begin{equation} u_G(x_f) = (\alpha_{t0} + \alpha_{s0} + \alpha_{d0}) x_f^2 + \sum_{i=1}^N (\alpha_{ti} + \alpha_{si} + \alpha_{di}) u_i (x_f) \tag{3.2} \end{equation}\]
If, after the comment period, the strategic environment is unchanged, and officials remain unpersuaded to change their beliefs about which segments of society deserve favor, \(\alpha_s\) and \(\alpha_d\) are 0, and the model collapses to the original information game based on fixed tastes. This outcome is less plausible when groups go public and expand the scope of conflict.
Adding these parameters resolves a puzzling result of Libgober’s model. Empirically, rules that receive comments do not always change. This result is impossible in a model where bureaucrats only have known fixed tastes and potential commenters only seek policy changes. For policy-seeking organizations to lobby but fail to influence policy requires that they are either uncertain or wrong about an agency’s allocative bias or their ability to shift it. Incorporating political information allows change and thus uncertainty in an agency’s biases.
Even if we assume that policymakers’ allocative preferences are known, allowing them to be influenced by commenters means that one commenter’s incentives to comment now depend on other commenters’ lobbying strategies. This characterization of rulemaking aligns much more closely with empirical studies that show organizations provide technical information as a means of persuading policymakers. Likewise, this characterization of rulemaking aligns with my theory that groups mobilize public pressure campaigns to generate political information that could persuade agency officials to change their position for political reasons.
Thus far, I have mostly focused on more direct ways that pressure campaigns may inform and persuade bureaucratic policymakers. However, interest groups and the public attention they mobilize also influence policy outcomes indirectly by affecting an agency’s strategic environment. The remainder of this section focuses on how public pressure campaigns may affect one key part of a bureaucrat’s strategic environment: attention from members of Congress.
3.2.5 Congressional Oversight as a Mediator of Interest-group Influence
When George W. Bush replaced Bill Clinton as president, career bureaucrats at the Federal Trade Commission (FTC) knew that this meant a change in policy priorities. Many rulemaking projects initiated under the Clinton administration were likely to be withdrawn or put on hold. They also knew that the new administration wanted to be perceived as advancing a new policy agenda, not merely reversing Clinton-era policies. Policy entrepreneurs within the agency saw a political window of opportunity to initiate a new regulatory agenda to curb a growing volume of telemarketing calls. This initiative seemed likely to be popular with voters but, even with a supportive president, would be difficult to advance over the objections of the telemarketing industry, whose campaign donations had earned them many powerful allies in Congress. Agency officials reported being pessimistic about the FTC’s telemarketing effort overcoming opposition from Congress.
When the draft “Telemarketing Sales Rule” (also known as the “Do Not Call” rule) was published, however, public support and engagement were overwhelming. The rule received thousands of supportive comments from frustrated members of the public who were encouraged to comment by advocacy groups like the Consumer Federation of America. Agency officials reported that the volume of public response not only encouraged the agency and the administration but, more importantly, “scared off” members of Congress that the industry was relying on to kill or reverse the rule (personal communication, 2018). Once it became clear that the public was paying attention and sufficiently mobilized to act on the issue, elected officials became much less willing to take unpopular positions to support industry donors. Instead, Congress ended up codifying the agency’s authority to implement the Do Not Call regulations with legislation the following year.
The story of the Do Not Call rule suggests that public engagement in rulemaking may occasionally be influential because it affects the behavior of elected officials who have the power to provide key support or opposition to a proposed rule. Public attention and support gave agency officials “political cover” to advance their policy agenda (personal communication, 2018). Public pressure campaigns demobilized political opposition, changing the agency’s political environment and policy outcomes.
Wilson notes a similar pattern with the FTC’s Funeral Industry Practice Rule and Used Car Rule:
Undertakers and used-car dealers were outraged by these proposed rules. Very quickly, members of Congress discovered just how many undertakers and car dealers they had in their districts and how well-connected they were. The FTC suddenly had activated large, hostile interests who were successful in getting Congress to force the agency to back down (Wilson 1989, 83).
Members of Congress often learn about issues from—and are spurred to act by—public pressure campaigns. Legislators often submit comments from their constituents, either on their own or attached to their own comments. For example, several members of Congress attached mass mail or petitions from their constituents to their comments on the Consumer Financial Protection Bureau’s controversial Payday Loan rule. Public pressure campaigns often seek to influence policy by informing elected officials of their constituents’ demands. Many campaigns collect the zip code of letter-signers so that they can forward constituent comments to their representatives. Some form letters include a line for signers to “CC” (carbon copy) their member of Congress (see, for example EPA-HQ-OAR-2005-0161-2624). When members of Congress comment on agency rules, they are often aware of public pressure campaigns. Many are clearly spurred to engage in bureaucratic policymaking pressure campaigns and their constituents who participate in them.
3.2.5.1 Principal-agent Relationships During Rulemaking
Political oversight of bureaucracies has long concerned both practitioners and theorists. Political scientists often model the relationship between elected officials and bureaucrats as a principal-agent problem. For example, an agency may have a preferred policy but may change the rule or delay its publication upon observing its principals’ preferences. Agencies may do this to avoid political consequences such as having their policies reversed (Potter 2017b) or because they perceive elected officials as representing public demands (Cuéllar 2005).
While it is widely accepted that agency officials take their principals’ positions into account, the mechanisms by which this occurs and the empirical conditions for political influence are unclear.
I focus on lobbying influence in the period between the publication of draft and final rules and thus on information about principals’ preferences revealed to the agency in this period. In principal-agent terms, this means I am focusing on “agency policymaking,” where the agency makes the first move and members of Congress react, perhaps threatening future sanctions (Ferejohn and Shipan (1990)). Oversight during rulemaking is a form of ex-post control (David Epstein and O’Halloran 1994), in this case, after the proposed rule is published. Upon learning the content of a draft rule, an official with power over the agency may choose to signal their demands to the agency. Elected officials may also engage in procedural oversight, but these procedural demands almost always accompany substantive policy demands (Lowande and Potter 2021).
There is a long-running debate among scholars over how political oversight operates—i.e., how the behaviors of elected officials inform agency decisions. Mathew D. McCubbins and Schwartz (1984) suggest two oversight mechanisms. Principals may proactively attend to agency activities, like a “police patrol,” or they may rely on bureaucrats’ fear of sanction when attentive interest groups alert principals about agency activities, like a “fire alarm.” Administrative procedures like mandatory public comment periods thus offer opportunities for both proactive oversight and to be alerted to oversight opportunities (Steven J. Balla 1998).
While theories of “fire alarm” and “police patrol” oversight focus on instances where legislators object to bureaucrats’ actions, Congressional attention may also support bureaucrats in fights with powerful interest groups. Indeed, like interest groups, the comments of members of Congress often support proposed rules. For example, in 2016, a group of Democratic legislators wrote encouraging words to Obama’s Treasury Department: “We urge you not to yield to the intense lobbying against these regulations, directed both at Treasury and the Congress, by multinational business and its trade associations.” In this example, congressional oversight is explicitly supportive of agency action. Rather than reacting to agency wrongdoing, these members were spurred to act by becoming aware of pressure groups lobbying the agency.
Lobbying campaigns increase the salience of the rulemakings they target. In addition to attracting allies in Congress, increased public attention may capture the attention of members of Congress on the opposite side of the issue. For example, when the Department of the Treasury published draft rules implementing the Unlawful Internet Gambling Act of 2006, the proposal generated unusually high levels of public attention. As a result, two bipartisan groups of legislators submitted comments on the rule. One group, led by the chair of the House Judiciary Subcommittee on Commercial and Administrative Law, raised concerns about the Department’s implementation of the Administrative Procedure Act. The other group of legislators, led by Senator Mike Pence, pushed back against interest-group opposition to the rule and urged the Department to implement the rules. Public pressure campaigns may increase the likelihood that legislators on both sides of the issue engage.
3.2.6 Incorporating Political Information into Models of Political Oversight
In addition to interest groups directly alerting elected officials to oversight opportunities as in the “fire alarm” model, the political information signaled by public pressure campaigns may alert elected officials to political risks (like a “warning sign”) or, conversely, to encourage the agency to hold course (like a “beacon”) attracting positive attention and credit claiming opportunities for their oversight work. In the case of the FTC’s “Do Not Call” rule and subsequent legislation, mass engagement functioned more as a “warning” for would-be opponents and a “beacon” for potential allies, effectively enabling and empowering rather than restraining the agency as the classic “police patrol” and “fire alarm” concept suggests. Table ?? expands the “fire alarm” model of congressional oversight (Mathew D. McCubbins and Schwartz 1984) to include other ways in which interest groups may affect oversight.
The fire alarm, beacon, and warning sign mechanisms have a common thread: interest groups’ public pressure campaigns affect political oversight. To the extent that this is strategic, pressure campaigns aim to influence policy indirectly by affecting the behavior of elected officials.
Figure 3.2 incorporates these insights to the model set out in Figure 3.1. Specifically, it considers how elected officials’ decisions to engage in agency rulemaking are affected by political information created by public pressure campaigns and create new, additional political information. Figure 3.2 shows two pathways by which lobbying organizations may cause elected officials to contact agency officials. The upper pathway represents the classic “fire alarm” role that interest groups may play in alerting elected officials to oversight opportunities. It also captures the related dynamic where interest groups alert elected officials to opportunities to support agency actions.
The lower causal pathway represents the additional role that I suggest interest groups play in political oversight by generating political information through public pressure campaigns. When lobbying organizations use a public pressure strategy, the political information they create (e.g., about the scale and intensity of public support) may affect agency policymakers directly, as shown in Figure 3.1. Additionally, levels of public support may also affect policy indirectly if it affects the behavior of an agency’s political principals (e.g., members of Congress). When political principals contact agency officials, they create at least two additional kinds of political information. First, they express their opinion on what they think the agency should do, which may have normative power for bureaucrats. Second, principals signal political consequences that agencies may want to avoid (Potter 2017a). Both types of information may persuade agency officials to revise policy documents to address their principals’ comments.
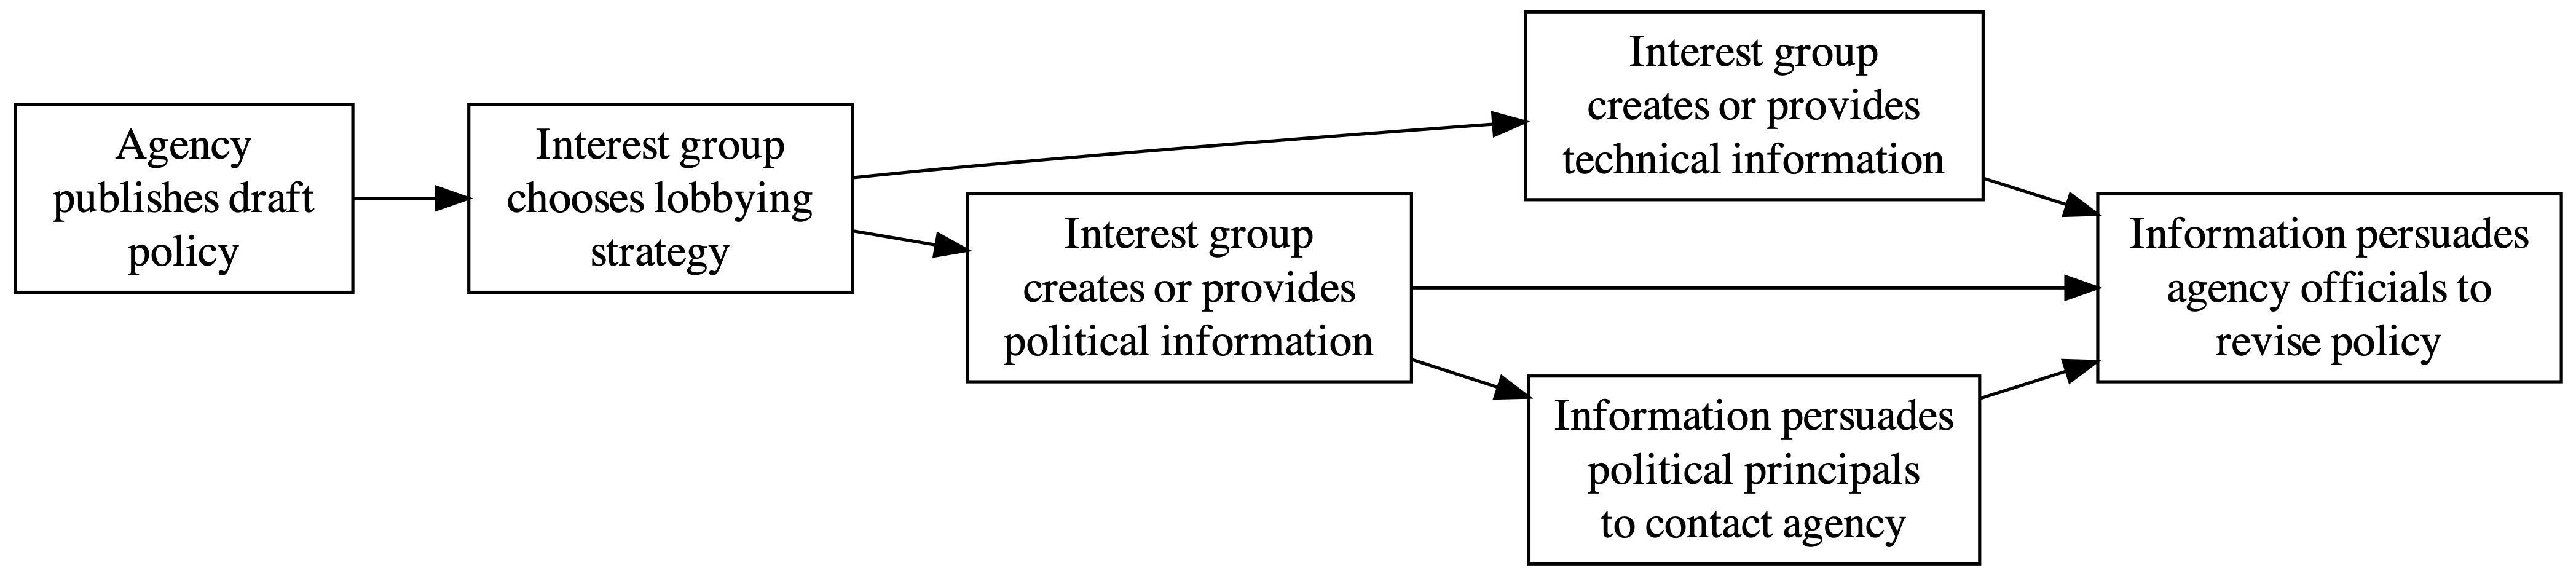
Figure 3.2: Direct and Indirect Effects of Political Information: Integrating Public Pressure and Congressional Oversight into a Model of Lobbying in Bureaucratic Policymaking
Public pressure campaigns in bureaucratic policymaking may affect the behavior of an agency’s principals because the shadow of public sanction hangs over elected officials (Arnold 1979; Mayhew 2000). Moore (2018) finds that agencies that receive more comments per rule are also subject to more congressional hearings. When the public is more attentive, it is more important for officials to take popular positions and avoid unpopular ones. Thus, when a coalition goes public, especially if it generates a perceived consensus in expressed public sentiments, elected officials may be more likely to intervene on their behalf and less likely to intervene against them. Hypotheses 3.5 and 3.6 reflect these intuitions.
3.2.7 Hypotheses about the relationship between mass engagement and oversight
If Hypothesis 3.4 is correct, we should observe more members of Congress engaging in policy processes with larger public pressure campaigns. This hypothesis is difficult to test because legislators being mobilized directly by interest groups is often observationally equivalent to legislators being mobilized indirectly due to the response to a public pressure campaign. Above, I offer anecdotal evidence that legislators are aware of pressure campaigns and see comments from their constituents as important. Still, evidence of correlation is not strong evidence of a causal effect. If, however, we can reject Hypothesis 3.4, this is strong evidence that rulemaking comments from members of Congress are not affected by the scale of public attention.
If Hypothesis 3.5 is correct, it would suggest a supplement to Hall and Miler’s (2008) finding that legislators are more likely to engage in rulemaking when a like-minded interest group has lobbied them: when interest groups lobby elected officials to engage in rulemaking, they may also be more likely to engage when aligned with the majority of commenters than when opposed to them. If elected officials learn from political information, then they will be even more likely to engage when lobbied by a coalition that includes public interest groups running a mass-comment campaign, and less likely to engage when opposed by a large mass comment campaign.12
Alternatively, the effect of mass engagement on legislators may be asymmetric. Mass engagement may only mobilize or only demobilize. For example, if legislators are risk-averse, they may avoid engaging in contentious rulemaking processes regardless of the balance of comments. Or, elected officials may be attracted to oversight opportunities but not dissuaded by mobilization on the other side because they assume their voters share their position. These results would be evidence against Hypothesis 3.5 and Hypothesis 3.6, respectively.
I thus build on the ``classic model” of political oversight in two ways. First, I suggest that such oversight behaviors may be affected by public pressure campaigns because of the impressions of public opinion (i.e., the political information) they create. This is represented by the arrow between “Organization generates political information” and “Political principals contact agency officials” in Figure 3.2.
Second, I suggest that elected officials’ comments during rulemaking are a particularly relevant oversight behavior and a mechanism by which bureaucrats learn and update beliefs about their principals’ demands. This is represented by the arrow between “Political principals contact agency officials” and “Agency officials revise policy” in Figure 3.2. The mechanism is labeled “Information persuades agency officials,” which includes information about principal opinions and perceived political consequences.
3.3 Testing the Theory
3.3.1 Data: A Census of Public Comments
To examine the relationship between public pressure campaigns and lobbying success, I use an original dataset (introduced in Section 2.3.1) that combines several data sources on U.S. federal agency rulemaking.
The core data for this analysis are the texts of draft and final rules and public comments on these proposed rules published from 2005 to 2020. This includes all proposed rules from 161 agencies that were open for comment on regulations.gov between 2005 and 2020, received at least one comment from an organization, and saw a final agency action between 2005 and 2020. These 44,774 rulemaking dockets received a total of 58,380,146 comments.
I collected draft and final rule texts from federalregister.gov and comments submitted as digital files or by mail from regulations.gov. I also retrieve comments submitted directly on regulations.gov and metadata on rules and comments (such as the dates that the proposed rule was open for comment and whether the agency identified the organization submitting the comment) from the regulations.gov Application Programming Interface (API). I add additional metadata on rules (such as whether the rule was considered “significant”) from the Unified Agenda published by the Office of Information and Regulatory Affairs (reginfo.gov).
Where a new presidential administration used the same docket number to solicit comments on a proposed rule that a previous administration used, I count these as separate rulemaking dockets. I do so because the second policy usually reverses or moves policy in the opposite direction of the previous administration. The same organizations often comment on both policies but with opposite positions. Support becomes opposition and vice versa.
3.3.1.1 Clustering with text reuse
My theoretical approach requires that I attribute form letter comments to the organizations, campaigns, and broader coalitions that mobilized them. To do so, I identify comments that share text. I find that a 10-word phrase repeated across more than a few comments is always either text copied from the proposed policy or a form letter provided by a campaign. Thus, for each comment text, I first remove all 10-word phrases that appear in the proposed rule (including the preamble and call for comments). Then, I identify all comments that share ten-word phrases with 99 or more other comments. Finally, I collapse these form letter comments to one representative document for hand-coding.
I attempt to identify the organization(s) that submitted or mobilized each comment by extracting all organization names from the comment text. For comments that do not reference an organization, an internet search using portions of the comment’s text often identified the organization that provided the form letter text. I then identify lobbying coalitions both by hand and by textual similarity. Co-signed comments are always assigned to the same coalition. Likewise, form-letter comments are always assigned to the same coalition.
Through the iterative combination of automated search methods and hand-coding described in Section 2.3.2, I attribute each comment to the organization behind it (its author if submitted by the organization or the mobilizing organization for form letters). I also identify comments submitted by elected officials, with special attention to members of the U.S. Congress.
Because my hypotheses are about the influence of organizations and coalitions, I collapse these data to one observation per organization or coalition per proposed rule for analysis. I then identify the main substantive comment submitted by each organization’s staff or lawyers, which are usually much longer than supporting comments like form letters.
3.3.1.2 Hand-coded sample
To estimate the influence of public comments on policy, I use hand-coded comments on a random sample of rulemaking dockets. For each rule in the sample, almost all comments are hand-coded for their level of lobbying success. Hand-coding includes recording the type of organization, the lobbying coalition to which each comment belongs, the type of coalition (primarily public or private interests), their policy demands, and the extent to which the change between the draft and final rule aligned with their demands. This level of alignment between policy demands and policy outcomes is my measure of lobbying success. It does not identify a causal relationship (true policy influence), but it is the standard approach for assessing lobbying success with these kinds of observational data (see J. W. Yackee and Yackee 2006). For a more detailed description of the coding process, the codebook is available in Appendix A.
I first selected a random sample of 31 proposed rules with both a mass-comment campaign and a final rule. I then selected all comments that were likely to be from organizations.13 The hand-coding process included identifying the organization responsible for each comment submitted by an organization (e.g., a business, nonprofit, or government).
I then selected a sample of 45 proposed rules on which the same organizations commented without a mass comment campaign. While most studies of mass comment campaigns to date have focused on the Environmental Protection Agency, my combined sample rules come from 36 agencies. Additionally, my sampling approach includes rules with very small and very large numbers of comments that previous studies exclude.
I include all comments submitted as file attachments or emails, but only some comments typed in a text box. Sophisticated lobbying organizations almost always submit comments as file attachments. I include comments typed in a text box if they share text with other comments, indicating they are part of a pressure campaign. This includes nearly all comments on most rules. I exclude entirely unique textbox contents and comments shorter than ten words. Most textbox comments and nearly all extremely short comments are trivial (e.g., “This sucks”). While form letters are often short, they are very unlikely to be less than ten words. For comments sharing text, I code one sample document for all versions of the form letter.
My approach to measuring lobbying success starts with policy demands raised in comments. The dimensions of conflict on which I judge lobbying success are those issues identified by commenters. Unlike other studies, the issues I use to assess lobbying success do not come from first reading the policy or of any a priori concept of what each policy fight is about. Instead, I read the change between draft and final rule with an eye for alignment with commenters’ requests (including requests that specific parts of the draft policy do not change.)
Using commenter requests to identify the dimensions of the conflict has advantages and disadvantages. Compared to other potential measures of success, it is more likely to focus on things that commenters care about and miss policy issues that other, non-commenting segments of the public might care about.
Other approaches to identifying the commenter’s relationship with policy changes have different strengths and weaknesses. For example, one could measure success by the number of times a comment is mentioned in the agency’s response to comments. However, this measure may be affected by strategic responsiveness by agencies choosing to discuss some issues more than others. It also counts explicit rejections toward the measure of responsiveness. One could also measure success by focusing on a priori potential aspects of the policy. Steven J. Balla et al. (2020) count five factors: (1) the number of regulated entities, (2) the number of activities or substances being regulated, (3) the level of pollution standards, (4) the compliance and effective deadlines of the regulation, and (5) the monitoring and reporting requirements. Each takes one value (increasing or decreasing), and each is weighted equally in the analysis. In contrast, by starting with comments, my method relies on commenters to define the dimensions of conflict and highlight the issues they care most about. In this sense, my approach focuses on “the first face of power”—issues that are already on the agenda of the broader policy system.
The hand-coded sample includes 6,171 hand-coded documents representing over NA million comments (including both mass comments and the sophisticated comments they support).
| Docket ID | Coalition | Comment type | Organization | Position | Success |
|---|---|---|---|---|---|
| DOT-OST-2018-0068 | A4A | Org | American | Supports Rule | 1 |
| DOT-OST-2018-0068 | AAAE | Org | Finnair Plc | Supports Rule | 2 |
| FEMA-2016-0003 | AASA | Org | Aasa. Aesa | Opposes Rule | 2 |
| FEMA-2016-0003 | AASA | Org | Sam Walton | Opposes Rule | 2 |
| OCC-2020-0026 | ACLU | Org | ACLU | Opposes Rule | -2 |
| OCC-2020-0026 | ACLU | Org | Hoosier Action | Opposes Rule | -2 |
| PHMSA-2012-0082 | AFL-CIO | Org | AFL-CIO | Supports Rule | -2 |
| PHMSA-2012-0082 | AFL-CIO | Org | City Of Skokie | Supports Rule | -2 |
| ED-2016-OESE-0032 | AFT | Org | AFT | Supports Rule | 1 |
| USCIS-2006-0044 | AILA | Org | Centro Romero | Opposes Rule | -1 |
| USCIS-2006-0044 | AILA | Org | World Relief | Opposes Rule | 0 |
| WHD-2019-0001 | ANCOR | Org | Easterseals | Supports Rule | -2 |
| WHD-2019-0001 | ANCOR | Org | Leadingage | Supports Rule | -2 |
| USCG-2010-0990 | BOATU.S. | Org | Boatu.s. | Opposes Rule | -1 |
| DOT-OST-2018-0068 | CCD | Org | Autism Speaks | Opposes Rule | -2 |
| CFPB-2019-0006 | CFSA | Elected | Nolan Mettetal | Supports Rule | 2 |
| CFPB-2019-0006 | CFSA | Elected | Mike Osburn | Supports Rule | 2 |
| IRS-2019-0039 | CLC | Elected | Steve Bullock | Opposes Rule | -2 |
| IRS-2019-0039 | CLC | Org | Issue One | Opposes Rule | 2 |
| ETA-2020-0006 | CUPA-HR | Org | TECHNET | Supports Rule | 1 |
| USCBP-2007-0064 | EAA | Org | Sas Institute | Supports Rule | 1 |
| BSEE-2018-0002 | EARTHJUSTICE | Org | Sierra Club | Opposes Rule | -2 |
| BSEE-2018-0002 | EARTHJUSTICE | Org | OCEANA | Opposes Rule | -2 |
| WHD-2019-0001 | EPI | Org | AFL-CIO | Opposes Rule | -1 |
| WHD-2019-0001 | EPI | Org | Network Lobby | Opposes Rule | -1 |
| CFPB-2016-0025 | EQUIFAX | Org | EQUIFAX | Supports Rule | 1 |
| CFPB-2016-0025 | EQUIFAX | Org | EQUIFAX | Supports Rule | -2 |
| FWS-HQ-ES-2018-0097 | FARM BUREAU | Org | Farm Bureau | Supports Rule | 2 |
| DEA-2018-0005 | HSCA | Org | Kratom United | Opposes Rule | -2 |
| DEA-2018-0005 | HSCA | Org | VIZIENT | Opposes Rule | -1 |
| DOT-OST-2018-0068 | IAADP | Org | Autism Speaks | Supports Rule | -1 |
| ETA-2020-0006 | ITSERVE | Org | AFL-CIO | Opposes Rule | -2 |
| ETA-2020-0006 | ITSERVE | Org | Microsoft | Opposes Rule | -2 |
| OSHA-H005C-2006-0870 | KIMBERLY-CLARK | Org | Kimberly-Clark | Supports Rule | 2 |
| OCC-2020-0026 | MLA | Org | WEBBANK | Supports Rule | 2 |
| OCC-2020-0026 | MLA | Org | Finwise Bank | Supports Rule | 2 |
| ED-2016-OESE-0032 | NAACP | Org | National Place | Supports Rule | 2 |
| ED-2016-OESE-0032 | NAACP | Org | NAEHCY | Supports Rule | 2 |
| CFPB-2019-0006 | NACA | Elected | Jesse Arreguin | Opposes Rule | -2 |
| CFPB-2019-0006 | NACA | Elected | Jamie Raskin | Opposes Rule | -2 |
| CFPB-2019-0006 | NAFCU | Org | NAFCU | Supports Rule | 2 |
| CFPB-2019-0006 | NAFCU | Org | CUNA | Supports Rule | 1 |
| ICEB-2015-0002 | NAFSA | Mass | Uaw Local 4121 | Supports Rule | 1 |
| ICEB-2015-0002 | NAFSA | Org | IBM | Supports Rule | 2 |
| CFPB-2016-0025 | NCUA | Org | NFIB | Opposes Rule | -1 |
| CFPB-2016-0025 | NCUA | Org | CTECU | Supports Rule | 2 |
| FEMA-2016-0003 | NEMA | Org | State Of Maine | Supports Rule | 2 |
| FEMA-2016-0003 | NEMA | Org | City Of Norman | Supports Rule | 2 |
| OSHA-H005C-2006-0870 | NEWPORT NEWS | Org | AFL-CIO | Supports Rule | 1 |
| OSHA-H005C-2006-0870 | NEWPORT NEWS | Org | Public Citizen | Supports Rule | 1 |
| FWS-HQ-NWRS-2012-0086 | NRDC | Org | Sierra Club | Supports Rule | -2 |
| FEMA-2016-0003 | NRDC | Org | Smartersafe | Supports Rule | -2 |
| NOAA-NMFS-2011-0117 | OCEANA | Mass | OCEANA | Supports Rule | -2 |
| NOAA-NMFS-2011-0117 | OCEANA | Org | OCEANA | Supports Rule | -2 |
| TREAS-DO-2007-0015 | OTHER BANKS | Org | M&T Bank | Opposes Rule | 1 |
| TREAS-DO-2007-0015 | OTHER BANKS | Org | ECCHO | Opposes Rule | 2 |
| NOAA-NMFS-2013-0050 | PEW | Mass | Earthjustice | Opposes Rule | -2 |
| NOAA-NMFS-2013-0050 | PEW | Org | Sound Seas | Opposes Rule | -2 |
| WHD-2019-0001 | PPWO | Org | Argentum | Supports Rule | -2 |
| WHD-2019-0001 | PPWO | Org | Corps Network | Supports Rule | -2 |
| ED-2016-OESE-0032 | PUBLIC SCHOOLS | Org | Dysart Usd | Supports Rule | 1 |
| ED-2016-OESE-0032 | PUBLIC SCHOOLS | Org | Alvarado Isd | Supports Rule | 1 |
| BSEE-2013-0011 | SHELL | Elected | Lisa Murkowski | Opposes Rule | -2 |
| BSEE-2013-0011 | SHELL | Elected | Shelley Hughes | Opposes Rule | 1 |
| WHD-2019-0003 | SHRM | Org | FEDEX | Supports Rule | 2 |
| WHD-2019-0003 | SHRM | Org | Seyfarth Shaw | Supports Rule | 1 |
| PHMSA-2012-0082 | SIERRA CLUB | Mass | Credo Action | Supports Rule | -2 |
| OCC-2011-0014 | SIFMA | Org | SIFMA | Supports Rule | 2 |
| OCC-2011-0014 | SIFMA | Org | SIFMA | Supports Rule | -2 |
| FEMA-2016-0003 | USRC | Org | Air Worldwide | Supports Rule | -2 |
| ICEB-2015-0002 | VERIZON | Org | VERIZON | Supports Rule | 1 |
| WHD-2019-0001 | WFCA | Org | Kullman Law | Supports Rule | 1 |
| WHD-2019-0001 | WFCA | Org | Bloomin Brands | Supports Rule | 1 |
Table 3.1 shows a sample of hand-coded public comments. Docket ID is the identifier for each rulemaking. The Organization, Comment Type, and Coalition columns show how coders record the name and type of each organization or elected official, as well as the broader coalition to which they belong. The name assigned to each coalition is usually the name of one of the lead organizations.
The Position column in Table 3.1 is a collapsed version of the spatial position-coding described in Section 2.3.2.4 and Appendix A. To create a binary measure of support and opposition, I collapse the coding of each comment’s spatial position into a dichotomous indicator of whether they ultimately support or oppose the rule. Finally, Lobbying Success—whether each comment got what it asked for in the change between a draft and final rule—is coded on a five-point scale from 2 to -2. “2” indicates that most of the commenter’s requests were met. If the rule moved decidedly in the opposite direction as they would have liked it to move, this is coded as a “-2” (the opposite of total success). To measure these variables at the coalition level, I use the coding assigned to the lead organization or the average across coalition members. Because “lead” organizations are identified based on their leadership role in the coalition and the extent to which they represent the coalition’s policy demands, the lead organization’s coding is nearly the same as the average across coalition members in all cases.
| Organization | Rules Lobbied On |
|---|---|
| U.S. Chamber of Commerce | 27 |
| Natural Resources Defense Council | 10 |
| OCEANA | 10 |
| Earthjustice | 9 |
| National Audubon Society | 9 |
| Sierra Club | 8 |
| American Petroleum Institute | 7 |
| Center For Biological Diversity | 7 |
| Edison Electric Institute | 7 |
| National Association Of Manufacturers | 7 |
| National Wildlife Federation | 7 |
| Pew Charitable Trusts | 7 |
| AFL-CIO | 6 |
| Environmental Defense Fund | 6 |
| Farm Bureau | 6 |
| NAACP | 6 |
| National Association Of Home Builders | 6 |
| National Mining Association | 6 |
| Port Gamble S’klallam Tribe | 6 |
| Public Citizen | 6 |
| Quinault Indian Nation | 6 |
| American Bankers Association | 5 |
| American Bird Conservancy | 5 |
| Associated Builders And Contractors | 5 |
| Associated General Contractors Of America | 5 |
| Association Of Oregon Counties | 5 |
| Defenders Of Wildlife | 5 |
| Endangered Species Coalition | 5 |
| International Association Of Drilling Contractors | 5 |
| International Bancshares Corporation | 5 |
| Materion Brush Inc. | 5 |
| National Employment Law Project | 5 |
| Nature Conservancy | 5 |
| Nez Perce Tribal Executive Committee | 5 |
| North Slope Borough | 5 |
| Ocean Conservancy | 5 |
| Safari Club International | 5 |
| Southern Environmental Law Center | 5 |
| State Of Alaska | 5 |
| Aca International | 4 |
| Aircraft Owners And Pilots Association | 4 |
| American Association Of State Highway And Transportation Officials | 4 |
| Animal Welfare Institute | 4 |
| Blue Water Fishermen’s Association | 4 |
| Center For Regulatory Effectiveness | 4 |
| Coalition To Protect America’s National Parks | 4 |
| Columbia River Inter-Tribal Fish Commission | 4 |
| Confederated Tribes Of Warm Springs | 4 |
| Consumer Bankers Association | 4 |
| County Of Siskiyou | 4 |
| Economic Policy Institute | 4 |
| Florida Fish And Wildlife Conservation Commission | 4 |
| Freedomworks Foundation | 4 |
| Friends Of The Clearwater | 4 |
| Independent Community Bankers Of America | 4 |
| Institute For Policy Integrity | 4 |
| Kentucky Equal Justice Center | 4 |
| Maryland Consumer Rights Coalition | 4 |
| National Association Of Conservation Districts | 4 |
| National Congress Of American Indians | 4 |
| National Parks Conservation Association | 4 |
| National Wild Turkey Federation | 4 |
| National Women’s Law Center | 4 |
| Northeast Seafood Coalition | 4 |
| Ocean Conservation Research | 4 |
| Portland Cement Association | 4 |
| Snoqualmie Indian Tribe | 4 |
| South Atlantic Fishery Management Council | 4 |
| Southern Ute Indian Tribe | 4 |
| Summit Lake Paiute Tribe | 4 |
| Union Of Concerned Scientists | 4 |
| Wilderness Society | 4 |
| Wyoming Stock Growers Association | 4 |
| AARP | 3 |
| Alaska Oil And Gas Association | 3 |
| American Association Of Airport Executives | 3 |
| American Bar Association | 3 |
| American Council Of The Blind | 3 |
| American Exploration & Mining Association | 3 |
| American Immigration Lawyers Association | 3 |
| American Road & Transportation Builders Association | 3 |
| American Society Of Civil Engineers | 3 |
| American Staffing Association | 3 |
| Americans For Tax Reform | 3 |
| Association Of Metropolitan Water Agencies | 3 |
| Association To Preserve Cape Cod | 3 |
| Baker County | 3 |
| Better Markets | 3 |
| Catholic Charities Usa | 3 |
| Chesapeake Bay Foundation | 3 |
| City Of Portland | 3 |
| College And University Professional Association For Human Resources | 3 |
| Confederated Tribes Of Grand Ronde | 3 |
| Conference Of State Bank Supervisors | 3 |
| Conocophillips | 3 |
| Consumer Reports | 3 |
| Consumers’ Research | 3 |
| Credit Union National Association | 3 |
| Delaware Department Of Transportation | 3 |
| Domestic Energy Producers Alliance | 3 |
Table 3.2 shows the organizations that commented on the most rules in this sample: 522 organizations lobbied on more than one rule in the hand-coded data, some on as many as -Inf rulemaking dockets. Recall that this sample of rules is weighted toward rulemaking dockets that received more comments. Thus, the organizations lobbying on the most rules are not the same as those in the overall population. For example, recall from Table 3.1 that the American Petroleum Institute lobbied on nearly 400 rules, whereas the Pew Charitable Trusts lobbied on 120. Pew, however, used a public pressure campaign 5 percent of the time it lobbied, whereas the American Petroleum Institute used a public pressure campaign 0.3 percent of the time it lobbied. Thus, groups like Pew that more often use pressure campaigns are more likely to be lobbying on rules in this sample. While this sampling approach was necessary (a random sample of all rules would yield almost none with a pressure campaign), the statistical results should be interpreted as disproportionately reflecting variation in lobbying success in high-salience and contentious rulemakings.
Table 3.3 shows the number of hand-coded rules, documents, the coalitions and organizations to which those documents belong, and the total number of comments they represent for a sample of agencies. As expected with a random sample, the agencies with the most rules in this sample are also those with the most final rules posted to regulations.gov (as shown in Figure 2.5). The Environmental Protection Agency (EPA), Fish and Wildlife Service (FWS), and National Oceanic and Atmospheric Agency (NOAA), Department of Transportation (DOT), and Internal Revenue Service (IRS) are all in the top ten agencies by the number of rulemaking dockets on regulations.gov. The Bureau of Safety and Environmental Enforcement, Consumer Financial Protection Bureau (CFPB), and Wage and Hour Division (WHD) of the Department of Labor are all above average and have a disproportionate number of rules with a large number of comments, making these agencies more likely to be selected into the weighted sample. Table 3.3 also illustrates how my method of collapsing documents with repeated text to one representative document allows me to reduce the number of documents requiring hand-coding by several orders of magnitude (compare the “Documents” and “Comments” columns).
| Agency | Rules | Documents | Coalitions | Organizations | Comments |
|---|---|---|---|---|---|
| NOAA | 7 | 323 | 27 | 162 | 514,761 |
| FWS | 6 | 881 | 23 | 508 | 1,677,778 |
| BSEE | 4 | 243 | 13 | 195 | 114,368 |
| CFPB | 3 | 1,003 | 18 | 817 | 12,982 |
| DOT | 2 | 174 | 9 | 111 | 174 |
| IRS | 2 | 53 | 4 | 46 | 29,897 |
| OCC | 2 | 122 | 6 | 106 | 267 |
| USCIS | 2 | 129 | 6 | 71 | 129 |
| WHD | 2 | 264 | 8 | 214 | 44,613 |
| CEQ | 1 | 850 | 1 | 577 | 411,383 |
| DEA | 1 | 15 | 3 | 15 | 15 |
| DOI | 1 | 41 | 2 | 36 | 41 |
| ED | 1 | 318 | 18 | 298 | 318 |
| ETA | 1 | 55 | 6 | 44 | 55 |
| FEMA | 1 | 380 | 9 | 349 | 3,139 |
| ICEB | 1 | 303 | 4 | 65 | 303 |
| MSHA | 1 | 52 | 3 | 43 | 52 |
| NPS | 1 | 100 | 3 | 68 | 100 |
| OFCCP | 1 | 188 | 4 | 31 | 7,173 |
| OSHA | 1 | 161 | 4 | 69 | 161 |
| PHMSA | 1 | 401 | 4 | 364 | 335,313 |
| TREAS | 1 | 60 | 8 | 52 | 60 |
| USCBP | 1 | 37 | 2 | 30 | 37 |
| USCG | 1 | 12 | 2 | 10 | 12 |
Figure 3.3 shows hand-coded support and opposition to proposed rules by different types of commenters and presidential administration. Support and opposition coding come from the spatial position regarding the draft and final rule, as shown in Figure 2.10. Comments from a corporation (“Corp.”) were overwhelmingly opposed to Obama-administration policies and more supportive of Trump-administration policies. Elected officials more often write in opposition than in support of a proposed rule across administrations. In contrast, individuals, organizations, and the mass comments these organizations mobilized overwhelmingly supported Obama-administration policies and opposed Bush- and Trump-administration. Mass and individual comments are especially polarized. This reflects the partisan asymmetry in mobilizing organizations; the individuals (unique comments) and mass comments (form letters) mobilized by progressive public interest groups’ campaigns overwhelmingly supported Obama-era policies and opposed Trump-era policies.
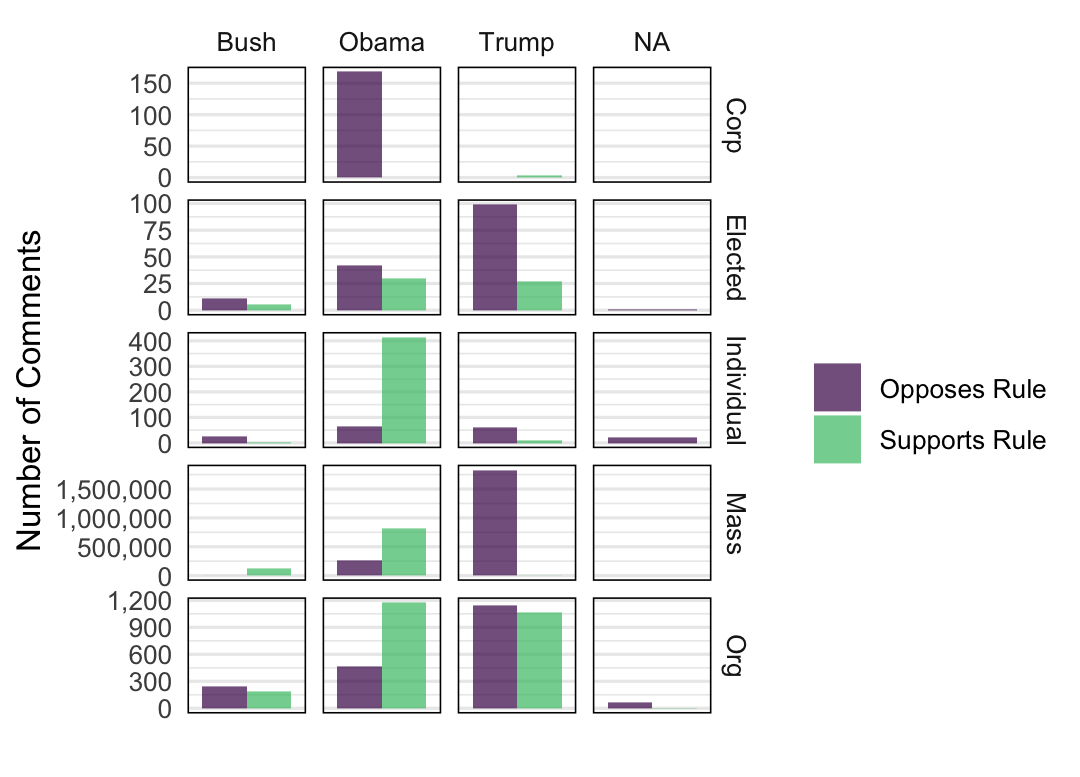
Figure 3.3: Hand-coded Comments By Type and Position on Proposed Rule
Most of these comments belong to lobbying coalitions and are thus not independent observations. When Friends of the Earth and the Sierra Club lobby together on a rule, the success of each depends on the other. Thus, I group comments into coalitions. The hand-coded sample includes 256 “coalitions,” 102 of which are single-organization “coalitions” (not coalitions), leaving 154 true coalitions of multiple organizations lobbying together.
Lobbying coalitions range in size from 2 to 217 organizations. Table 3.4 shows a sample of coded data, summarized at the coalition level. Even though the same organization may lead coalitions in multiple rulemakings, each rule’s lobbying coalitions are different, so I consider them separate observations. For example, the American Civil Liberties Union (ACLU) led a coalition in 2014 with a small number of organizations and a medium-size pressure campaign in support of a rule requiring additional Equal Employment Opportunity reporting from the Department of Labor’s Office of Federal Contract Compliance Programs (OFCCP). The ACLU also led a very different coalition in 2020 with a large number of organizations and a very small public pressure campaign against a rule rolling back regulations on banks published by the Office of the Comptroller of the Currency (OCC). Figure 3.6 shows that this sample is fairly balanced between coalitions that succeed and fail to get the changes they seek in the final rule.
| Docket ID | Coalition | Position | Size | Businesses | Type | Mass |
|---|---|---|---|---|---|---|
| DOT-OST-2018-0068 | A4A | Supports Rule | 17 | 6 | Public | 0 |
| OCC-2020-0026 | ACLU | Opposes Rule | 75 | 0 | Public | 158 |
| OFCCP-2014-0004 | ACLU | Supports Rule | 11 | 0 | Public | 7,141 |
| ICEB-2015-0002 | AFL-CIO | Supports Rule | 5 | 2 | Public | 0 |
| USCIS-2010-0017 | AFL-CIO | Opposes Rule | 2 | 0 | Public | 0 |
| ED-2016-OESE-0032 | AFT | Supports Rule | 3 | 0 | Public | 0 |
| TREAS-DO-2007-0015 | AHC | Supports Rule | 1 | 0 | Private | 0 |
| DEA-2018-0005 | AMA | Supports Rule | 3 | 3 | Public | 0 |
| CFPB-2016-0025 | CBC | Supports Rule | 1 | 0 | Public | 0 |
| ETA-2020-0006 | CUPA-HR | Supports Rule | 6 | 4 | Public | 0 |
| WHD-2019-0003 | EPI | Opposes Rule | 40 | 1 | Public | 44,352 |
| DEA-2018-0005 | HSCA | Opposes Rule | 9 | 3 | Public | 0 |
| NA | HSCA | Opposes Rule | 1 | 0 | Public | 0 |
| DOT-OST-2018-0068 | IAADP | Supports Rule | 12 | 1 | Public | 0 |
| OCC-2011-0014 | ISDA | Supports Rule | 1 | 1 | Private | 0 |
| ETA-2020-0006 | ITSERVE | Opposes Rule | 15 | 9 | Private | 0 |
| OCC-2020-0026 | MLA | Supports Rule | 13 | 12 | Private | 0 |
| DOT-OST-2018-0068 | N/A | Opposes Rule | 1 | 1 | Private | 0 |
| USCIS-2010-0017 | NCAPA | Supports Rule | 14 | 5 | Public | 0 |
| WHD-2019-0001 | NCPA | Supports Rule | 16 | 9 | Private | 0 |
| FEMA-2016-0003 | NCSL | Opposes Rule | 2 | 0 | Public | 0 |
| CFPB-2019-0006 | NCUA | Supports Rule | 5 | 3 | Private | 0 |
| ETA-2020-0006 | NFAP | Supports Rule | 5 | 2 | Public | 0 |
| FWS-R9-ES-2008-0093 | NMBA | Supports Rule | 2 | 2 | Public | 0 |
| FWS-HQ-NWRS-2012-0086 | NRDC | Supports Rule | 13 | 0 | Public | 53,258 |
| USCIS-2006-0044 | NYCLA | Supports Rule | 3 | 0 | Public | 0 |
| NOAA-NMFS-2011-0117 | OCEANA | Supports Rule | 5 | 0 | Public | 12,882 |
| BSEE-2012-0005 | PEW | Supports Rule | 4 | 0 | Public | 1,526 |
| BSEE-2013-0011 | PEW | Supports Rule | 15 | 0 | Public | 24,911 |
| FEMA-2016-0003 | PEW | Supports Rule | 217 | 201 | Public | 2,765 |
| NOAA-NMFS-2008-0096 | PEW | Supports Rule | 17 | 2 | Public | 124,675 |
| NOAA-NMFS-2012-0059 | PEW | Opposes Rule | 31 | 3 | Public | 102,845 |
| NOAA-NMFS-2013-0050 | PEW | Opposes Rule | 8 | 1 | Public | 75,238 |
| DEA-2018-0005 | PHRMA | Supports Rule | 3 | 2 | Public | 0 |
| BSEE-2013-0011 | SHELL | Opposes Rule | 90 | 78 | Private | 87,690 |
| FEMA-2016-0003 | SSIT | Opposes Rule | 1 | 0 | Public | 0 |
| IRS-2016-0015 | SWISS RE | Supports Rule | 1 | 1 | Private | 0 |
| CFPB-2019-0006 | TRUE | Opposes Rule | 1 | 0 | Public | 0 |
| TREAS-DO-2007-0015 | UC GROUP | Opposes Rule | 1 | 1 | Private | 0 |
| ICEB-2015-0002 | VERIZON | Supports Rule | 3 | 1 | Public | 0 |
| WHD-2019-0001 | WFCA | Supports Rule | 54 | 38 | Private | 0 |
| CFPB-2019-0022 | WSECU | Supports Rule | 1 | 0 | Public | 0 |
| TREAS-DO-2007-0015 | XPRESSBET | Opposes Rule | 1 | 1 | Private | 0 |
Table 3.5 shows the number of coalitions coded as “public interest” and “private interest” by whether the majority of organizations in the coalition are for-profit businesses and trade associations or non-businesses (governments and nonprofits): 37 percent are majority business coalitions. 62 percent are public-interest coalitions. As Table 3.5 shows, the hand-coded “public interest vs. private interest” distinction is highly correlated with the share of businesses in the coalition but not perfectly. These two measures diverge in cases where public interest coalitions mobilize a large number of business allies or where private interest coalitions mobilize a large number of non-business allies. Thus, while the share of businesses and trade associations is more objective, the public-private distinction is likely a better measure of coalition type. I estimate alternative models in Section 3.4 with each measure.
| Coalition Type | Business led | Non-business led | Mass comments | No mass comments |
|---|---|---|---|---|
| Private | 78 | 20 | 11 | 87 |
| Public | 16 | 140 | 35 | 123 |
Several coalitions may lobby on the same rule. One coalition’s lobbying success is correlated with another coalition’s lobbying success to the extent that they are asking for the same or contradicting policy changes. However, by grouping organizations into coalitions, I account for many of the causally-related policy requests (those organizations lobbying on an issue because another organization is lobbying on that issue).
3.3.1.4 The Dependent Variable: Lobbying Success
The dependent variable is the extent to which a lobbying coalition got the policy outcome it sought, which I measure in several ways.
First, on a sample of rules, I trained a team of research assistants to hand-code lobbying success for each organization or elected official, comparing the change between the draft and final rule to each organization’s demands on a five-point scale from “mostly as requested” to “significantly different/opposite from requested direction” as described in Section 2.3.2. Additionally, for each comment, coders identify the main overall policy demand, the top three specific demands, and the corresponding parts of the draft and final rule texts. This does not capture rule changes on which no organization commented. While such changes may be significant, they not helpful for measuring lobbying success.
Lobbying success on each specific demand was then coded for each organization and coalition. Both the overall score and average score across specific demands both fall on the interval from -2 (“significantly different”) to 2 (“mostly as requested”). A team of undergraduate research assistants then applied the codebook to all comments likely to be from organizations or elected officials on a random sample of rules. Several rules were double-coded by the whole team.
In the models below, coalition lobbying success is the mean of hand-coded lobbying success on a five-point scale, {-2, -1, 0, 1, 2}.
The average hand-coded success per organizational comment is zero (N = 6,171). The average success for organizational comments with a mass comment campaign is -0.746 (N = 3,857).
3.3.1.5 The Main Predictor Variable
The number of supportive comments generated by a public pressure campaign (the main variable of interest) is a tally of all comments mobilized by each organization or coalition that ran a mass-comment campaign on a proposed rule. Because the marginal impact of additional comments likely diminishes, models typically include either the logged number of comments or a quadratic term to account for non-linear effects. If a coalition mobilizes more than 99 form-letter comments on a proposed rule, I code that coalition as having a mass comment campaign (campaign = 1). Where a coalition only submits technical comments from lawyers and does not mobilize public support, the binary measure, campaign, and the numeric measure, mass comments, are 0.
Figure 3.5 shows a scatterplot of the dependent variable (lobbying success) and main predictor (mass comments) for each coalition. Coalition lobbying success ranges from total success (2) to total loss (-2). The number of mass comments ranges from 0 to 701,917. The size of each point represents the size of each coalition (the number of organizations and elected officials). The color indicates whether the coalition is led by private or public interest groups. For example, one extremely large private coalition of payday lenders mobilized over a million comments during the Obama administration. This coalition was moderately successful at reducing the stringency of the regulation but did not stop it from going through.
The view of the data in Figure 3.5 does not show a clear relationship between public pressure and lobbying success. There were relatively more (and more successful) public interest campaigns in the Obama years. Likewise, there were more (and more successful) private interest campaigns in the Trump years. As predicted in 2.2, the largest campaigns are mostly public interest campaigns, and public interest campaigns are more frequent than private interest campaigns overall.
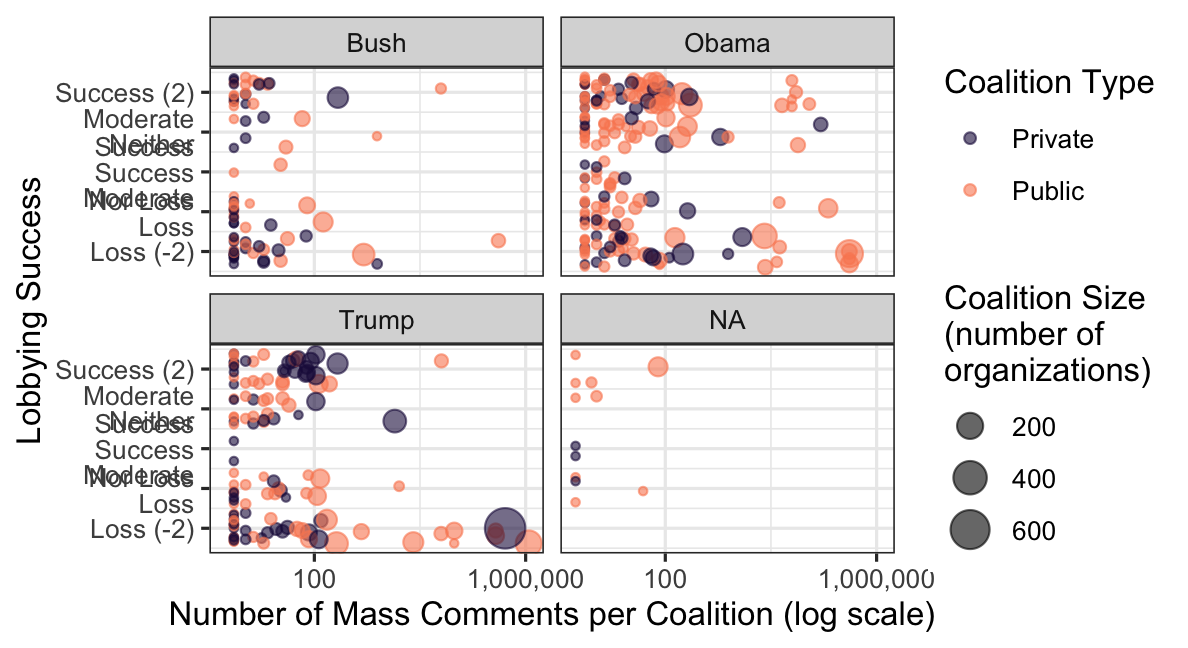
Figure 3.5: Lobbying Success by Number of Supportive Comments
This approach differs from previous studies of mass comment campaigns in at least two ways. First, my methods allow me to identify coalitions consisting of multiple organizations. Previous studies measure mass comment campaigns at the organization level. For example, Steven J. Balla et al. (2020) analyzes “1,049 mass comment campaigns that occurred during 22 EPA rulemakings”—an average of nearly 50 “campaigns” per rule. By “campaign,” Steven J. Balla et al. (2020) mean an organization’s campaign rather than a coalition’s campaign. Especially on EPA rules, there are rarely more than two or three coalitions engaging in public pressure campaigns–one of the environmental advocacy groups and their allies, another of regulated industry groups and their allies. Using organizations as the unit of analysis means that observations are far from independent. An analysis that counts one coalition’s campaign as 40 smaller “campaigns” with the same policy demands would count this one campaign as 40 observations.
In contrast, my methods allow me to measure levels of public pressure and lobbying success per organization and per coalition. Like previous studies, I identify the organizations responsible for mobilizing comments. Where other studies leverage the fact that the EPA gathers substantially similar comments, I am able to identify mass comment campaigns across dozens of federal agencies. Additionally, I further link common efforts by multiple organizations lobbying in a broader coalition. This allows for analysis with the lobbying coalition as the unit of analysis. By measuring comments per coalition, both through hand-coding and text reuse, I capture different levels of public pressure than we would see if we were only measure the number of comments per organization.
The second major difference between my approach and previous research is that I do not compare policymakers’ responses to sophisticated comments to policymakers’ responses to mass comments. Rather, I attribute mass comments to organizations and coalitions that also submit sophisticated technical comments. The set of comparisons one makes is critical to any study of responsiveness or policy influence. Researchers may reach different conclusions if they compare different things. Consider a study comparing how agencies respond to Sierra Club form letters to how they respond to the Sierra Club’s sophisticated comments. Now consider a study that compares responsiveness to the Sierra Club’s sophisticated comments between rules where they did and did not run a mass comment campaign. A study comparing the average influence of form-letter comments to the average influence of sophisticated comments is very different from a study that compares the influence of two sets of sophisticated comments with different levels of public pressure behind them. Where previous studies take the former approach, I take the latter.
3.3.1.6 Other predictor variables
Other predictors of lobbying success in the models below include the size of the lobbying coalition, whether the coalition is a business coalition, and whether the coalition is lobbying unopposed. The number and type(s) of organization(s) is an attribute of each coalition (e.g., a business coalition with N organizational members). Coalition size is a count of the number of organizations lobbying together on the rule, i.e., the number of distinct commenting organizations in each coalition. For organizations lobbying alone, coalition size is 1. Coalition is an indicator variable for whether the organization is lobbying in a coalition. It takes a value of 0 when coalition size is 1 and 1 if coalition size is greater than 1. A coalition is unopposed when no opposing organizations comment. This is derived from the hand-coded spatial position of each comment. If an organization supports the proposed rule and others oppose it, they have opposition. Likewise, if an organization opposes a proposed rule and others support it, they have opposition. However, if multiple coalitions support (or oppose) the rule for different reasons (e.g., one coalition would like one provision added while another coalition would like a different provision added), a rule may have multiple unopposed lobbying coalitions.
I code a coalition as a business coalition if the majority of commenting organizations are for-profit businesses and trade associations. Business is binomial. Alternative models in the Appendix use the number and share of businesses in a coalition instead.
3.3.1.7 Examples of hand-coded lobbying success
A rule with a public pressure campaign: the 2015 Waters of the United States Rule: In response to litigation over the scope of the Clean Water Act, the Environmental Protection Agency and Army Corp of Engineers proposed a rule based on a legal theory articulated by Justice Kennedy, which was more expansive than Justice Scalia’s theory. The Natural Resources Defense Council (NRDC) submitted a 69-page highly technical comment “on behalf of the Natural Resources Defense Council…, the Sierra Club, the Conservation Law Foundation, the League of Conservation Voters, Clean Water Action, and Environment America” supporting the proposed rule:
We strongly support EPA’s and the Corps’ efforts to clarify which waters are protected by the Clean Water Act. We urge the agencies to strengthen the proposal and move quickly to finalize it… ( EPA-HQ-OW-2011-0880-16674)
I coded this as support for the proposed rule. Specifically, NRDC would like the EPA to move policy further in the same direction. NRDC makes four substantive requests: one about retaining language in the proposed rule (“proposed protections for tributaries and adjacent waters…must be included in the final rule”) and three proposed changes (“we describe three key aspects of the rule that must be strengthened”).14 I also coded it as requesting speedy publication. These demands provide specific keywords and phrases for which to search in the draft and final rule text. By comparing the requested policy outcomes to the text of the final rule, I evaluate the extent to which NRDC got what it asked for.
A coalition of 15 environmental organizations mobilized over 944,000 comments. Over half (518,963) were mobilized by the four organizations mentioned in NRDC’s letter: 2421,641 by Environment America, 108,076 by NRDC, 101,496 by Clean Water Action, and 67,750 by the Sierra Club. Other coalition partners included EarthJustice (formerly a part of the Sierra Club, 99,973 comments) and Organizing for Action (formerly president Obama’s campaign organization, 69,369 comments). This is one of the larger campaigns in the dataset. This coalition made sophisticated recommendations and mobilized a million people in support of NRDC’s sophisticated lobbying.
The final rule moved in the direction requested by NRDC’s coalition, but to a lesser extent than requested—what I code as “some desired changes.” As NRDC et al. requested, the final rule retained the language protecting tributaries and adjacent waters and added some protections for “other waters” like prairie potholes and vernal pools. EPA did not alter the exemptions for ditches and waste treatment systems.
For this coalition, the dependent variable, Lobbying success is 1 on the scale from -2 to 2, coalition size is 15, business is 0, their position (supports rule) is 1, campaign is 1, and the number of mass comments is 943,931.
2009 Fine Particle National Ambient Air Quality Standards: In 2008, the EPA proposed a rule expanding air quality protections. Because measuring small particles of air pollution was once difficult, large particulates were allowed as a surrogate measure for fine particles under the EPA’s 1977 PM10 Surrogate Policy. EPA proposed eliminating this policy, requiring regulated entities and state regulators to measure and enforce limits on much finer particles of air pollution.
EPA received 163 comments on the rule, 129 from businesses, business associations such as the American Petroleum Institute and The Chamber of Commerce, and state regulators that opposed the rule. Most of these were short and cited their support for the 63-page comment from the PM Group, “an ad hoc group of industry trade associations” that opposed the regulation of fine particulate matter. Six state regulators, including Oregon’s, only requested delayed implication of the rule until they next revised their State Implementation Plans (SIPs) for Prevention of Significant Deterioration (PSD). EarthJustice supported the rule but opposed the idea that the cost of measuring fine particles should be a consideration. On behalf of the Sierra Club and the Clean Air Task Force, EarthJustice commented: “We support EPA’s proposal to get rid of the policy but reject the line of questioning as to the benefits and costs associated with ending a policy that is illegal.” The EarthJustice-led coalition also opposed delaying implementation: “EPA must immediately end any use of the Surrogate Policy—either by ‘grandfathered’ sources or sources in states with SIP‐approved PSD programs—and may not consider whether some flexibility or transition is warranted by policy considerations.”
The final rule did eliminate the Surrogate Policy but allowed states to delay implementation and enforcement until the next scheduled revision of their Implementation Plans. I code this as the EarthJustice coalition getting most of what it requested, but not a complete loss for the coalition lobbying on behalf of the regulated industry.
For the PM Group coalition, the dependent variable, coalition lobbying success is -1, coalition size is 129, business coalition is 1, pressure campaign is 0, and the number of mass comments is 0. For the State of Oregon’s coalition, the dependent variable, coalition lobbying success is 2, coalition size is 6, business coalition is 0, pressure campaign is 0, and the number of mass comments is 0. For the EarthJustice coalition, the dependent variable, coalition lobbying success is 1, coalition size is 3, business coalition is 0, pressure campaign is 0, and the number of mass comments is 0. These examples are broadly consistent with the overall data—lobbying success in these two examples is the same, despite the large difference in public pressure. This is not consistent with Hypotheses 3.1 or 3.3 that anticipated higher lobbying success with more public pressure.
Figures 3.6 and 3.7 show the distribution of values for coalition-level variables in the hand-coded data. Figure 3.6 shows a wide range of variation for coalition size and lobbying success, whereas the modal number of businesses is concentrated near 0. Most coalitions are between two and twenty members. About half have no business members, but a few have over 100. It is possible for the number of businesses to be larger than the coalition size where the same company sent in multiple comments. This occurs when franchised businesses mobilize local stores to send in letters. Because coalition size is the number of unique organizations, these are only counted once, but each is counted in the businesses variable.
Figure 3.7 shows that most coalitions in these data include no members of Congress, but some have as many as 18. The total number of mass comments is somewhat bimodal, reflecting the two random samples of rules from which these rules come. Most coalitions did not mobilize a pressure campaign and thus have no mass comments, but a few have over a million. The models below use either a binary indicator for mass comments, the logged value, or the number rescaled as hundreds of thousands of comments.
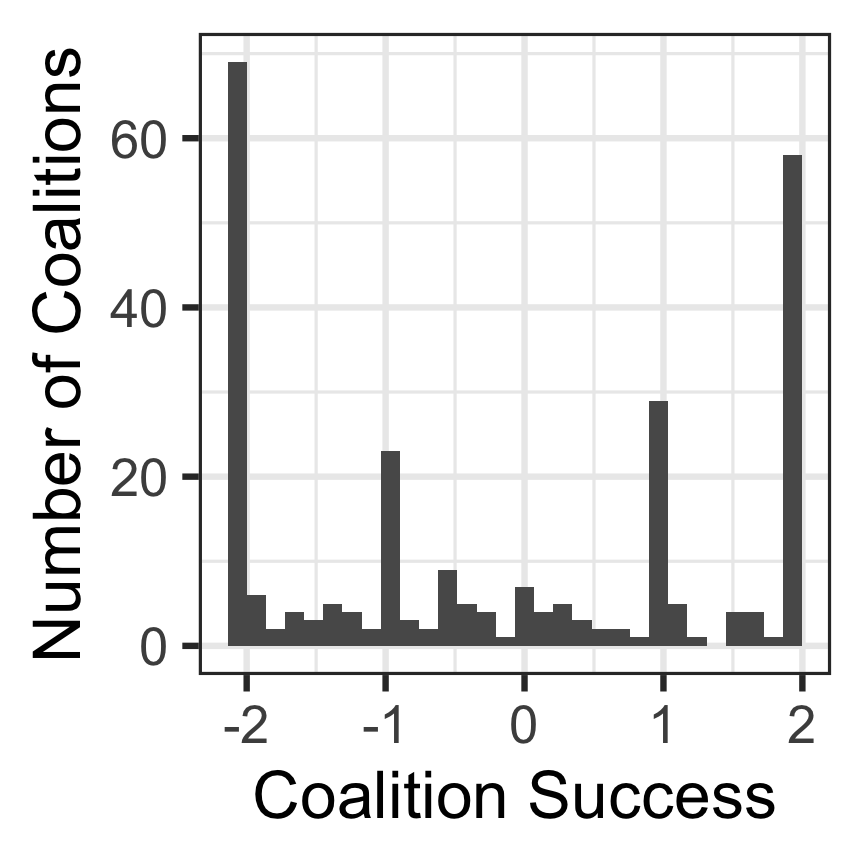
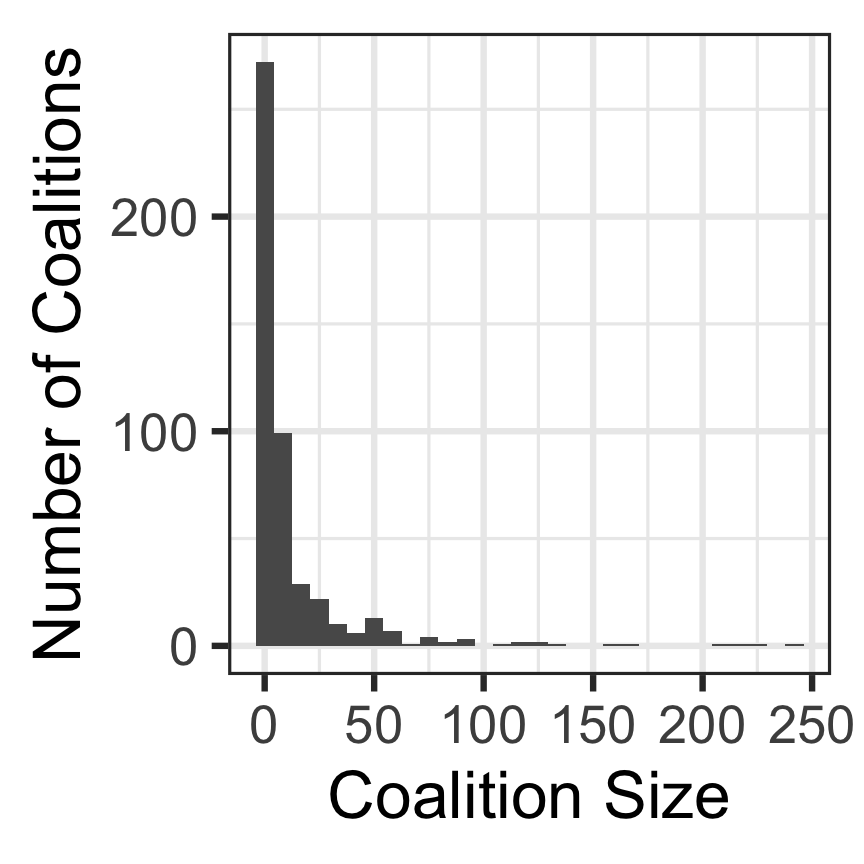
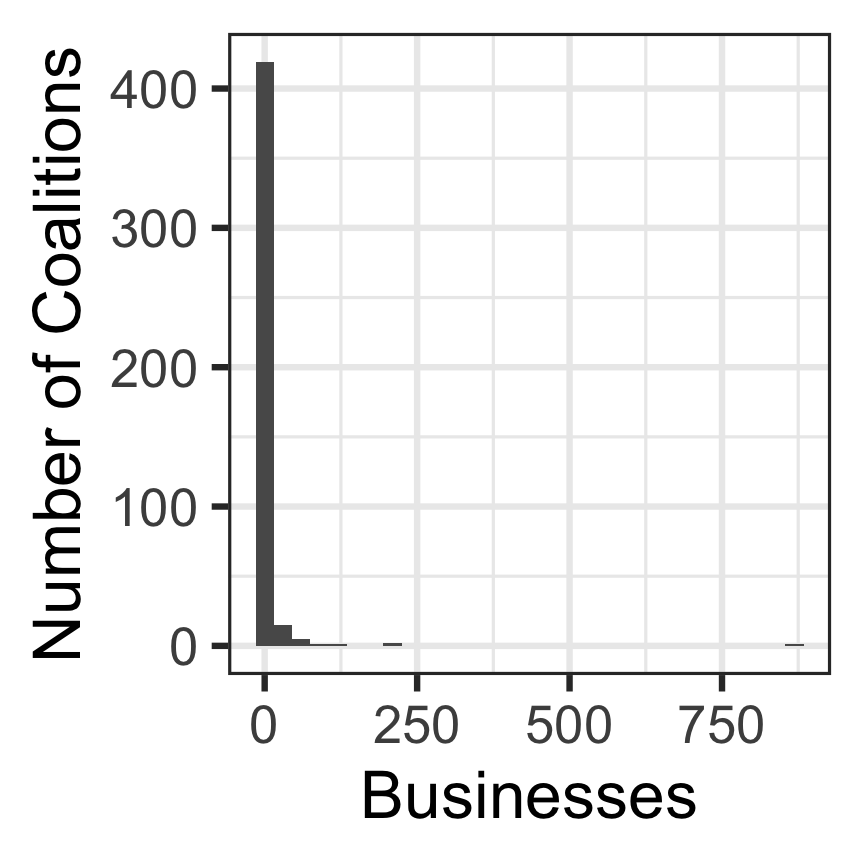
Figure 3.6: Hand-coded Data by Coalition
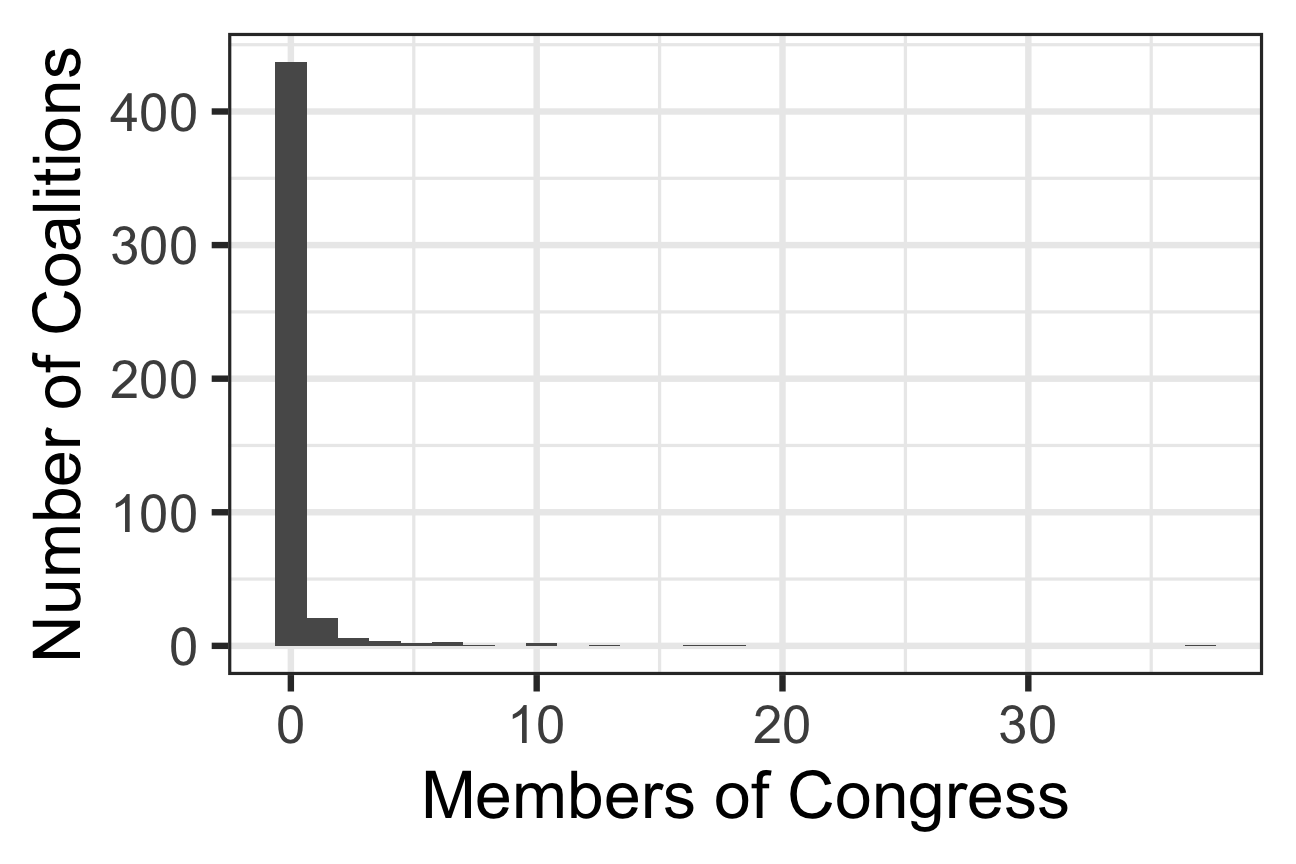
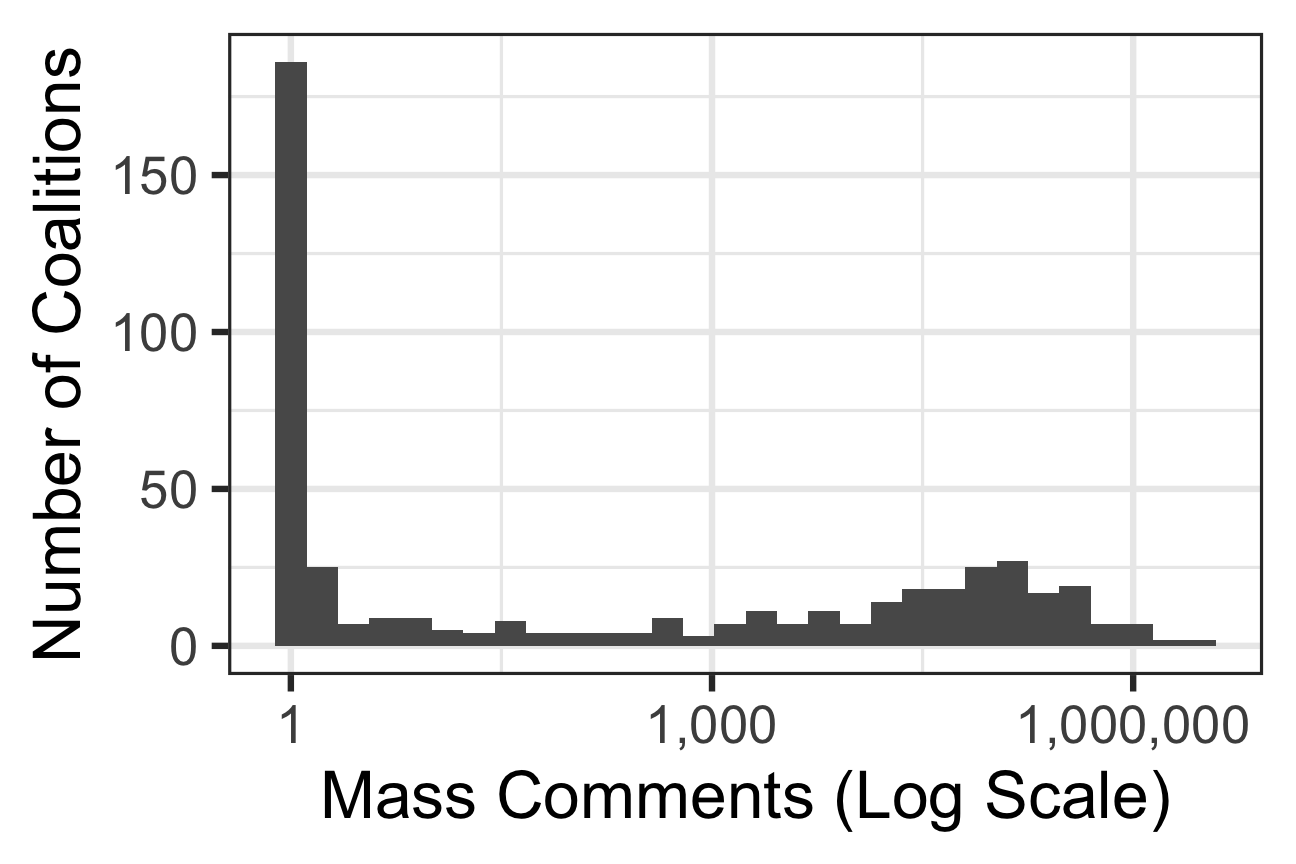
Figure 3.7: Number of Comments Linked to Hand-Coded Coalitions
3.3.1.8 Limitations
The two main limitations of this design both bias estimates of public pressure campaign influence toward zero.
First, lobbying success may take forms other than changes in policy texts. Agencies may speed up or delay finalizing a rule, extend the comment period, or delay the date the rule goes into effect. Indeed, commenters often request speedy or delayed rule finalization, comment period extensions, or delayed effective dates. While I capture lobbying success concerning timing, my hand-coding approach prioritizes change in policy text, which is more difficult to achieve. Where commenters rand both substantive and procedural (e.g., extended comment period) requests, I coded success concerning the substantive demands.
Second, bureaucrats may anticipate public pressure campaigns when writing draft rules, muting the observed relationship between public pressure and rule change at the final rule stage of the policy process. This is a limitation of all studies of influence during rulemaking comment periods.
3.3.2 Methods
The most direct way to assess the hypothesis that mass engagement increases lobbying success is to assess the relationship between the number of comments mobilized by a coalition and its lobbying success. The dependent variable for most analyses is the organization or coalition’s lobbying success, hand-coded on the interval between 2 (total success; the policy changed as requested) to -2 (total loss; the policy changed in the opposite direction requested). However, public pressure campaigns may only be effective under certain conditions. Specifically, pressure campaigns may help some types of coalitions more than others. Thus, I assess both the main relationship between pressure campaigns and lobbying success and the interaction between campaigns and coalition type. I then assess evidence for or against different potential causal pathways of influence. The main indirect pathway by which campaigns may influence agency policymaking is through engaging members of Congress.
These data have a hierarchical structure. Comment-level observations are nested within an organization, within a coalition, within a rule, within an agency, and an administration. I use a combination of fixed and random effects to account for dependence among observations at higher levels of analysis. The main models use data rolled up to the coalition level. Coalitions range from 1 to over 200 organizations in size and may include anywhere from 1 to over a million comments. Finally, I use a difference-in-difference design to assess variation in success within organizations that lobby on multiple rules.
3.3.2.1 Modeling Coalition-level Lobbying Success
3.3.2.1.1 The Direct Relationship Between Public Pressure and Lobbying Success
The dependent variable, \(Y\), is the lobbying success of each coalition. To estimate the relationship between a coalition’s lobbying success and the scale of public pressure it mobilizes, I model the success of each coalition \(i\) lobbying a rule \(j\) published by an agency \(k\) under a president \(p\). Each coalition is unique to a rule; each rule is unique to an agency (I assigned joint rules to the lead agency only) and presidential administration. I thus use the simpler notation \(y_i\) rather than the equivalent, more specific notation \(y_{ijkp}\).
The main variable of interest is the total number of form-letter public comments that a lobbying coalition mobilized. The base model (Equation (3.3)) uses an indicator for whether coalition \(i\) used a public pressure campaign, i.e., mobilized mass comments (by definition, more than 99 mass comments). \(\beta_1\) estimates the difference in lobbying success when coalition \(i\) uses a pressure campaign compared to when it does not. Other models use either the logged number of comments or a quadratic term to account for the different marginal effects of additional public comments for smaller and larger campaigns.
\[\begin{equation} Y_{i} = \beta_1 \textbf{Pressure campaign}_{i} + \beta_{2:n} X_i + \gamma_j + \delta_p + \epsilon_{i} \tag{3.3} \end{equation}\]
The base models include agency and president fixed effects (\(\gamma_k + \delta_p\)) and control for other coalition-level factors that may affect a coalition’s lobbying success, \(X_i\). Controls include whether the coalition is lobbying unopposed, the coalition’s size (the number of distinct organizations and elected officials), and the type of coalition (e.g., whether it is a business coalition or a public-interest coalition). \(\beta_{2:n}\) are the effects of these other coalition-level factors on lobbying success. I estimate these relationships using OLS regression.
3.3.2.1.2 Congressional Support as a Mediator of Lobbying Success
To assess congressional support as a mediator in the influence of public pressure campaigns on rulemaking, I estimate the average conditional marginal effect (ACME) and the proportion of the total effect attributed to mediation through congressional support (comments or other communication from Members of Congress supporting the coalition’s position on the proposed rule). As developed by Imai et al. (2010), this involves first estimating a model of the potential mediator as a combination of the main predictor, public pressure, and covariates, \(X_i\).
The mediator model (Equation (3.4)) estimates the relationship between the scale of public pressure and the number of comments from members of Congress, who may receive political information (e.g., about the level of public attention or public opinion) from public pressure campaigns.
\[\begin{equation} \textbf{Congressional Support}_{i} = \beta_0 + \beta_1 \textbf{Pressure Campaign}_{i} + \beta_{2:n} X_{i} + \gamma_k + \delta_p + \epsilon_{i} \tag{3.4} \end{equation}\]
The outcome model (Equation (3.5)) is the same as Equation (3.3), except that it now includes the number of supportive comments from members of Congress as a predictor. \(y_i\) is the Lobbying success of coalition \(i\) on a rule published by agency \(k\) under president \(p\). Pressure Campaign\(_{i}\) is an indicator for whether the coalition organized a pressure campaign, Congressional Support\(_{i}\) is the number of members of Congress supporting the coalition, and \(X_{i}\) are other coalition-level predictors of lobbying success. \(\beta_{3:n}\) are the effects of these other coalition-level covariates.
\[\begin{equation} Y_{i} = \beta_1 \textbf{Pressure campaign}_{i} + \beta_2 \textbf{Congressional Support}_{i} + \beta_{3:n} X_i + \gamma_j + \delta_p + \epsilon_{i} \tag{3.5} \end{equation}\]
The next section presents results from estimating the above models using the hand-coded data.
3.3.2.2 Difference in Differences in Organization-level Lobbying Success
While it would not be appropriate to compare the lobbying success of organizations within a rulemaking (because many organizations belong to the same coalition), we can compare the lobbying success within the same organization across rules. This limits the analysis to organizations that lobby on multiple policies. The key variation of interest is when organizations lobby with a public pressure campaign versus when they do not.
There is still a (lesser) problem with the i.i.d. assumption because two organizations lobbying in a coalition on one rule may mobilize each other to lobby in coalition on a different rule (in my data, lobbying coalitions are at the policy-level, since they differ from policy to policy).
At the organization level, the appropriate analysis is a difference-in-difference design. We know the success of each organization when it does and does not participate in a lobbying coalition that mobilizes public pressure (at least each organization that I can use for this analysis). The difference within an organization is now the key variation.
\[\begin{equation} Y_{ij} = \alpha_i + \beta_0 + \beta_1 \textbf{Pressure Campaign}_{ij} + \beta_{2-n} X_{ij} + \gamma_k + \delta_p + \epsilon_{ij} \tag{3.6} \end{equation}\]
Equation (3.6) is similar to the model of coalition-level success except that \(y_{ij}\) is now the lobbying success of organization \(i\) in coalition \(j\) and \(X_{ij}\) is now a vector of organization- and coalition-level controls. Additionally, Equation (3.6) adds \(\alpha_{i}\), a fixed effect for each organization. This fixed effect accounts for the organization’s characteristics that do not vary over time as it lobbies on multiple rules. This difference-in-difference design ensures that coefficient \(\boldsymbol{\beta}_1\) captures variation related to changes in levels of public pressure and other factors that vary within each organization, not other factors that may vary across organizations.
\({\beta}_{2:n}\) captures estimates for the effects of other factors that may affect an organization’s lobbying success, including coalition size, the difference in the success of organization \(i\) when they support proposed policy \(j\) rather than oppose it. \({President}_{j}\) is a dummy for whether policy \(j\) was proposed by President Trump or Bush rather than President Obama’s administration.
Assuming that organizations have parallel trends in their level of success given a level of support, \(\boldsymbol{\beta}\) represents the average effect of changing levels of public pressure on an organization’s lobbying success.
3.4 Results: Lobbying Success
This section leverages a random sample of agency rules for which I have hand-coded nearly all public comments. The first subsection presents estimates of the direct relationship between public pressure and lobbying success (Table 3.7). The next subsection presents results of mediation analysis, assessing the support from members of Congress as a mediator for the success of public pressure campaigns (Tables 3.8). The third subsection presents estimates of factors affecting within-organization levels of lobbying success using a difference-in-difference design (Table 3.9).
3.4.1 Coalition-level Lobbying Success
Table 3.7 presents results estimating coalition-level lobbying success as a function of public pressure, coalition size, coalition type, whether the coalition supports the proposed rule, and whether there is an opposing coalition, as described in Equation (3.3).
Models 1 and 2 use a binary measure of public pressure—did the coalition sponsor a public pressure campaign or not? Models 2-6 use continuous measures of public pressure. Models 3 and 4 use the logged number of mass comments, reflecting the intuition that one additional comment matters more for smaller campaigns. Models 5 and 6 include both linear and quadratic terms for the number of comments to allow for a wider array of possible non-linear relationships.
I use two related measures of coalition type. Models 1, 3, and 5 use my classification of coalitions as primarily public or private interests. Private interest is the omitted category, so coefficients are estimates of the difference in lobbying success for public interest coalitions compared to private interest coalitions. Models 2, 4, and 6 use a related, more objective measure: whether most coalition members are businesses or trade associations.
All models include fixed effects for agency and president to allow for differing average levels of lobbying success at different agencies and political conditions. These models include coalitions of 1 (organizations lobbying alone), but excluding them yields similar results, except that coalition size has a much weaker correlation with lobbying success.
| Model 1 | Model 2 | Model 3 | Model 4 | Model 5 | Model 6 | |
|---|---|---|---|---|---|---|
| Dependent Variable | Lobbying Success | Lobbying Success | Lobbying Success | Lobbying Success | Lobbying Success | Lobbying Success |
| Pressure Campaign | 0.448 | −0.673* | ||||
| (0.341) | (0.256) | |||||
| Public | 0.388 | 0.364 | 0.101 | |||
| (0.258) | (0.226) | (0.202) | ||||
| Coalition | −0.360 | −0.351 | −0.381 | −0.441 | −0.299 | −0.313 |
| (0.525) | (0.538) | (0.509) | (0.514) | (0.557) | (0.558) | |
| Log(Coalition Size) | 0.284* | 0.281* | 0.326** | 0.363*** | 0.208 | 0.210+ |
| (0.112) | (0.101) | (0.107) | (0.090) | (0.122) | (0.119) | |
| Supports Rule | 1.505*** | 1.533*** | 1.488*** | 1.497*** | 1.509*** | 1.512*** |
| (0.332) | (0.338) | (0.344) | (0.336) | (0.355) | (0.350) | |
| Pressure Campaign x Public | −1.490** | |||||
| (0.513) | ||||||
| Business Coalition | −0.232 | −0.223 | −0.169 | |||
| (0.276) | (0.265) | (0.243) | ||||
| Pressure Campaign x Business | 0.238 | |||||
| (0.887) | ||||||
| Log(Mass Comments) | −0.025 | −0.128*** | ||||
| (0.034) | (0.018) | |||||
| Log(Mass Comments) x Public | −0.120** | |||||
| (0.039) | ||||||
| Log(Mass Comments) x Business | −0.054 | |||||
| (0.138) | ||||||
| Mass Comments | −0.639* | −0.644* | ||||
| (0.258) | (0.234) | |||||
| (Mass Comments)^2 | 0.077+ | 0.078+ | ||||
| (0.043) | (0.040) | |||||
| Num.Obs. | 228 | 228 | 228 | 228 | 228 | 228 |
| R2 | 0.351 | 0.328 | 0.358 | 0.354 | 0.323 | 0.324 |
| Log.Lik. | −375.492 | −379.474 | −374.279 | −374.831 | −380.282 | −380.064 |
| Std.Errors | by: agency | by: agency | by: agency | by: agency | by: agency | by: agency |
| FE: agency | X | X | X | X | X | X |
| FE: president | X | X | X | X | X | X |
| + p < 0.1, * p < 0.05, ** p < 0.01, *** p < 0.001 | ||||||
Table 3.7 shows that the main effect of public pressure campaigns, \(\beta_1\), in Model 1 is 0.45 (S.E. = 0.49) on the five-point scale of lobbying success. Because these models include interactions with coalition type, the main effect is the estimated effect for the omitted category. In Model 1, this is the effect of a pressure campaign for a private interest group coalition. For public interest groups, the estimate is \(\beta_1 + \beta_6\) = NA, reflecting large negative interaction between indicators for public interest coalitions and pressure campaigns (Pressure Campaign x Public). Estimates are inconsistent across specifications.
Models 3-6 use continuous measures of the scale of public pressure campaigns. Estimates are inconsistent across specifications, but Models 5 and 6 suggest that the relationship is initially negative and then positive for very large campaigns (the combined effect of the linear and quadratic terms is negative until approximately one million comments). One possible explanation for this result is that only very large campaigns create meaningful information about public demands. In sum, there is little evidence that pressure campaigns (either public or private) increase lobbying success, but there is strong evidence that public interest campaigns are much less successful than private interest campaigns.
The other strongest predictor of lobbying success across all models is whether the organization supports the rule. In Model 1, coalitions supporting the proposed rule change had an average success 1.51 points greater than those that opposed the rule (S.E. = 0.2) on the five-point lobbying success scale. This estimate is fairly consistent across specifications in Models 1-6. This correlation likely reflects a combination of several related dynamics. First, final rules are often published without change from the draft rule. Organizations that support the new proposed rule are thus likely to “succeed” when the status quo (that is, the status quo set in the proposed rule) prevails. Second, organizations that support a proposed rule are necessarily aligned with agency officials’ preferred policy direction. If agency officials change the final rule to further change policy in their preferred direction, such changes often align with organizations that supported the rule. Likewise, if commenters are aligned with agency officials, their suggestions may be more likely to be adopted, even if those suggestions do not exactly push policy further in the same direction. Finally, by selecting proposed rules that had a final rule rather than being withdrawn, this sample is missing some lobbying success by organizations that requested a proposed rule be withdrawn.
In line with previous research, coalition size (the number of distinct organizations in a coalition) is correlated with lobbying success (J. W. Yackee and Yackee 2006; Nelson and Yackee 2012). This is notable because this sample includes rules with much more public attention and many more public comments than those used in previous studies. There is at least some evidence that these findings hold in much more salient and contentious policy fights.
The limited size of this sample means that we lack statistical power to have confidence that the estimates for many of the other variables differ from 0. Unlike previous studies on less contentious samples of rules (J. W. Yackee and Yackee 2006), I find no relationship between business-dominated coalitions (business coalition) and lobbying success.
As this sample consists disproportionately of draft rules that received an unusual number of comments, these results are largely based on the variation within high-salience rulemakings.
I now turn to a key variable omitted from the models in Table 3.7: the level of attention and support from an agency’s political principals—specifically, members of Congress, which may mediate the effect of public pressure campaigns.
3.4.1.1 Congressional Support as a Mediator of Lobbying Success
Hypothesis 3.4—that the overall level of public attention to a proposed rule moderates the level of attention from members of Congress—implies a correlation between the number of comments from members of Congress and all other comments on each rule. We should assess this correlation both across all rules and rules where at least one legislator commented, making it more plausible that legislators were aware of the rulemaking and thus faced the choice of whether to comment or not. Figure 3.8 shows both of these relationships. The dashed line shows the relationship between mass comments and comments from members of Congress for all rules. The solid line shows this relationship for rules where at least one legislator commented. The right-hand panel shows this same plot with both axes on a log scale, which allows us to better observe the relationship for rules with relatively fewer comments. There is a strong correlation between mass comments and legislator attention (Spearman’s rank correlation, \(\rho\) = 0.24, p-value = zero). However, for reasons discussed in 3.2.7, this should not be taken as strong evidence of a causal effect.
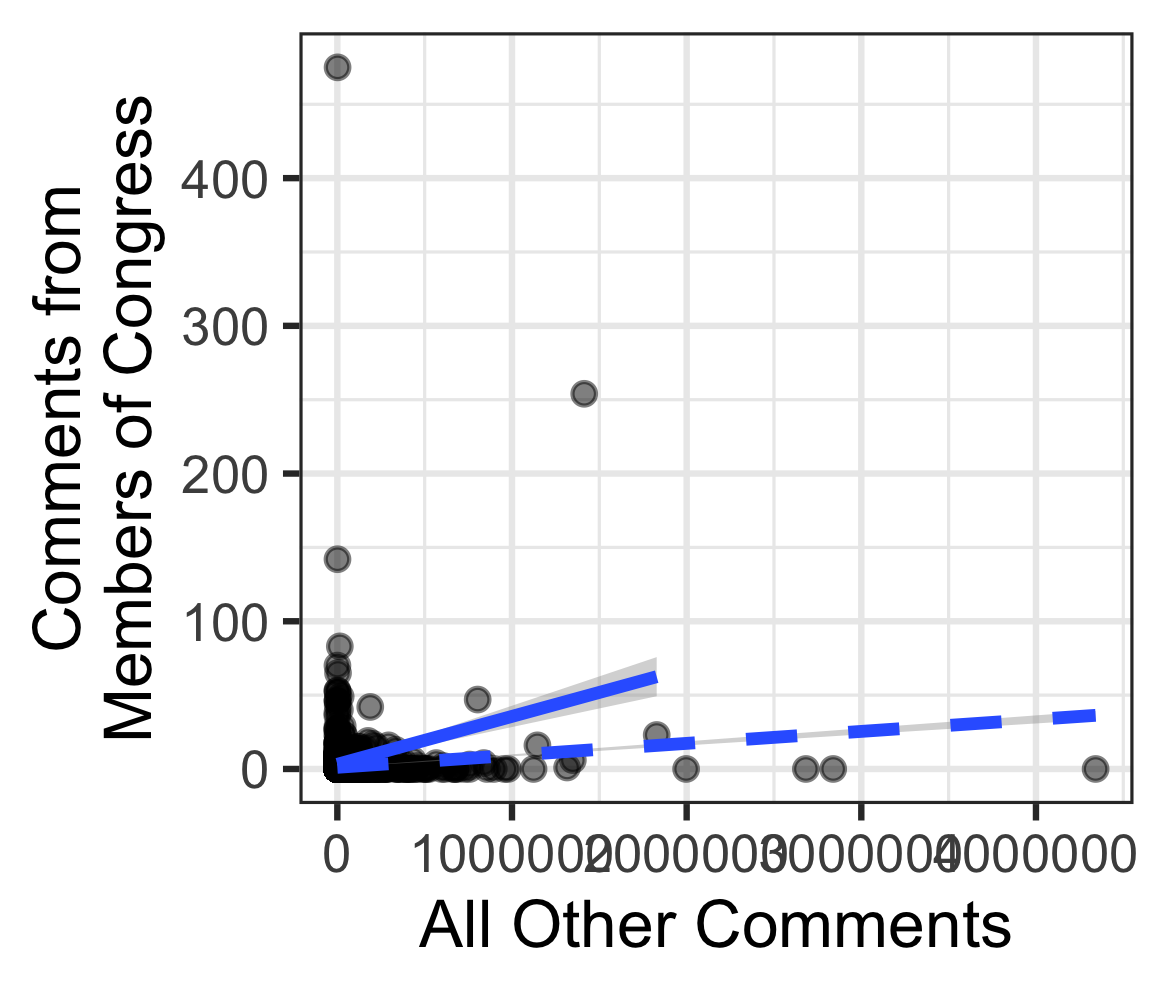
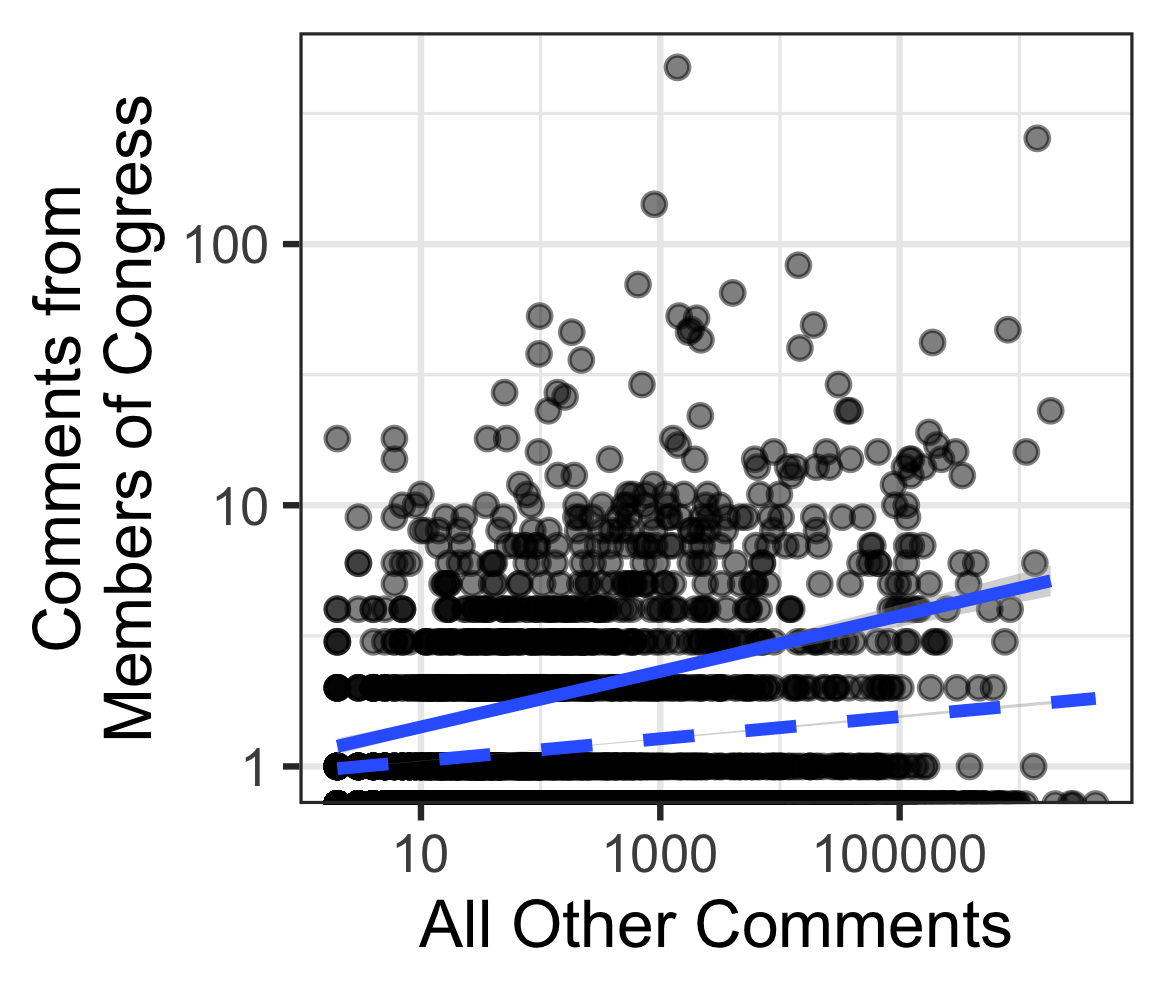
Figure 3.8: Correlation Between Mass Comments and Comments from Members of Congress
To assess congressional support as a potential mediator in the influence of public pressure campaigns on rulemaking, I estimate the average conditional marginal effect (ACME, conditional on the number of comments from Members of Congress) and average direct effect (ADE) of mass comments using mediation analysis. To do this, I estimate a model predicting the proposed mediator. Because the dependent variable (the number of supportive comments from members of Congress) is a count and the dispersion parameter is not significantly above 1, a Poisson model is most appropriate.
The first two models in Table 3.8 are similar to those in Table 3.7, but the dependent variable is now the mediator variable (the number of supportive members of Congress). The outcome model is the same as Model 1 in Table 3.7 but includes the proposed mediator, the number of supportive comments from members of Congress. (See Equation (3.4)).
By definition, only organizations lobbying in coalition with others have members of Congress in their coalition. Thus I exclude the “coalitions” of 1 organization and omit the indicator of whether the group is lobbying in the coalition from the model. I also subtract the number of members of Congress from the coalition size.
| Fire Alarm/Beacon Mediator Model (Poisson) | Warning Sign Mediator Model (Poisson) | Outcome Model (OLS) | |
|---|---|---|---|
| Dependent Variable | Members of Congress in Coalition | Members of Congress Opposing Coalition | Lobbying Success |
| Pressure Campaign | 0.771* | −0.306 | 0.163 |
| (0.373) | (0.261) | (0.310) | |
| Public | 0.739** | −0.353 | −0.342 |
| (0.232) | (0.235) | (0.309) | |
| Log(Coalition Size) | 0.145 | 0.042 | 0.182+ |
| (0.118) | (0.071) | (0.102) | |
| Supports Rule | −0.382** | 0.600** | 1.486** |
| (0.146) | (0.223) | (0.402) | |
| Pressure Campaign x Public | −0.568* | 0.441 | −0.725 |
| (0.260) | (0.355) | (0.462) | |
| Members of Congress | 0.008 | ||
| (0.023) | |||
| Num.Obs. | 147 | 147 | 147 |
| R2 | 0.421 | ||
| R2 Adj. | 0.277 | ||
| R2 Within | 0.307 | ||
| R2 Pseudo | 0.256 | 0.393 | |
| AIC | 502.7 | 556.1 | 499.8 |
| BIC | 589.4 | 642.8 | 589.5 |
| Log.Lik. | −222.335 | −249.059 | −219.879 |
| Std.Errors | by: agency | by: agency | by: agency |
| FE: agency | X | X | X |
| FE: president | X | X | X |
| + p < 0.1, * p < 0.05, ** p < 0.01, *** p < 0.001 |
The results shown in Table 3.7 do not offer much support for hypotheses 3.5—that pressure campaigns attract support from legislators—or 3.6—that they reduce legislator opposition. If 3.5 were correct, pressure campaigns should be correlated with the number of supportive letters from members of Congress (the DV in the first column). While the effects are in the expected direction, the coefficient on Pressure Campaign in the “Fire Alarm/Beacon” Mediator Model is not significantly different from 0 at the .05 level. If 3.6 were correct, pressure campaigns should be negatively correlated with the number of opposing comments from members of Congress (the DV in the second column). The coefficient on Pressure Campaign in the “Warning Sign” Mediator model is also not significantly different from 0.
There is some evidence for relationships other than those hypothesized. Public interest coalitions may be more likely to receive support and less likely to be opposed by members of Congress, all else equal. Public interest coalitions have 0.74 more supportive comments from members of Congress and have 0.35 fewer comments opposing them.
Because members of Congress are overall more likely to oppose proposed changes than organizations and pressure campaigns (see Figure 3.3), there is a negative relationship between supporting a proposed rule and the number of comments from members of Congress in one’s coalition. Likewise, there is a positive relationship between supporting a proposed rule and the number of members of Congress opposing one’s coalition.
The outcome model results (the third column in Table 3.7) are similar to the results of Model 1 in Table 3.7, despite dropping organizations lobbying alone. Again, the strongest predictor of lobbying success is supporting the direction of policy change. Adding congressional support to the model improves the model fit over Model 1 in Table 3.7 (comparing R-squared and log-likelihood). The number of supportive comments from members of Congress is associated with a 0.01 point difference in lobbying success (S.E. = 0.05).
While there is some evidence that public pressure campaigns affect the proposed mediator—support from members of Congress—there is little evidence for the main relationship of interest. Given this, the proposed mediation analysis does not offer much additional leverage on the hypotheses. The average effect of a public pressure campaign on lobbying success, conditional on letters from members of Congress (the ACME), is -0.08 on the 5-point scale, with a p-value of 0.126.
3.4.2 Difference in Differences in Organization-level Lobbying Success
I now turn from assessing variation across coalitions to variation within organizations as they lobby in multiple coalitions across policies and over time. Estimates in Models 1 of Table 3.9 show the results of estimating Equation (3.6). Model 2 presents results from a similar model with fixed effects for each rule rather than for each agency. Model 3 includes indicator variables for each president interacted with the main variables of interest (whether an organization lobbies with a coalition that mobilizes public pressure and whether an organization lobbies with a public or private interest coalition).
| Model 1 | Model 2 | Model 3 | |
|---|---|---|---|
| Dependent Variable | Lobbying Success | Lobbying Success | Lobbying Success |
| Pressure Campaign | −0.022 | −0.429 | −0.941 |
| (0.283) | (0.359) | (0.675) | |
| Public | −0.321 | −0.394+ | −0.686 |
| (0.227) | (0.231) | (0.520) | |
| Coalition | 0.453 | 0.210 | 0.376 |
| (0.451) | (0.438) | (0.459) | |
| Log(Coalition Size) | −0.099 | −0.015 | −0.051 |
| (0.107) | (0.114) | (0.106) | |
| Members of Congress | −0.029 | −0.026 | −0.016 |
| (0.025) | (0.030) | (0.024) | |
| Supports Rule | 0.865*** | 0.919*** | 0.783*** |
| (0.149) | (0.159) | (0.153) | |
| Pressure Campaign x Public | −1.170*** | −0.816* | 0.196 |
| (0.342) | (0.391) | (0.768) | |
| Trump | −1.506** | ||
| (0.516) | |||
| Bush | −0.130 | ||
| (0.579) | |||
| Pressure Campaign x Trump | 1.351+ | ||
| (0.741) | |||
| Pressure Campaign x Bush | 0.417 | ||
| (1.124) | |||
| Trump x Public | 0.740 | ||
| (0.557) | |||
| Bush x Public | −0.651 | ||
| (0.932) | |||
| Campaign x Public x Trump | −2.029* | ||
| (0.832) | |||
| Campaign x Public x Bush | −0.852 | ||
| (1.447) | |||
| Num.Obs. | 3870 | 3932 | 3870 |
| R2 | 0.848 | 0.865 | 0.851 |
| R2 Adj. | 0.267 | 0.329 | 0.273 |
| R2 Within | 0.103 | 0.104 | 0.133 |
| R2 Pseudo | |||
| AIC | 14392.7 | 14222.1 | 14339.5 |
| BIC | 33601.5 | 33931.6 | 33585.9 |
| Log.Lik. | −4128.339 | −3971.040 | −4095.771 |
| Std.Errors | by: Organization | by: Organization | by: Organization |
| FE: Organization | X | X | X |
| FE: agency | X | X | |
| FE: president | X | ||
| FE: Docket | X | ||
| + p < 0.1, * p < 0.05, ** p < 0.01, *** p < 0.001 |
Like the coalition-level models in Table 3.7, organizations were more likely to get their desired result when they supported the proposed rule. The effect sizes are smaller in the difference-in-difference specification but significantly different from zero.
The most notable result from models 1 and 2 is the negative correlation between lobbying success and the number of pressure campaigns organized by public interest groups (Pressure Campaign x Public). As discussed above, it is likely due to public interest campaigns “going down fighting,” whereas private interest campaigns are more likely to only lobby when they think they anticipate it increasing their chances of winning. Unlike private interest campaigns, some public interest campaigns are not trying to influence policy but instead build power for future policy fights (see Chapter 2. The fact that organizations are more likely to get the outcome they seek when they support the draft rule makes sense because the agency is more likely to be sympathetic to their requests.
The model in the third column of Table 3.9 clarifies that the large negative correlation between public interest campaigns and lobbying success is a result of losing campaigns during the Trump administration. Model 3 includes the president as an indicator variable interacted with the indicators for the pressure campaign and coalition type (whereas Models 1 and 2 estimate fixed effects for each president). First, it shows that the average organization was less likely to see its desired policy changes under President Trump than under President Obama. This is likely due to asymmetry in organizations in this sample of high-salience rules, with far more organizations on the political left than the political right in this sample of rules. Supporting this conclusion, there is a positive interaction between the indicators for a pressure campaign and for President Trump (Pressure Campaign x Trump) for private interest groups (the omitted category), but a very large negative relationship for public interest group campaigns under President Trump (Pressure Campaign x Public x Trump).
3.5 Conclusion
Public pressure campaigns appear to help private interests more than public interests on average. However, this correlation could have at least two observationally equivalent causes. First, my theory predicts a strong selection effect. By nature, public interest groups need to build grassroots power, contact lists, and a donor base to persist to fight the next day. Unlike businesses, public interest organizations thus have incentives to launch pressure campaigns even when they have little hope of influencing policy. Second, pressure campaigns from business groups are rarer and perhaps more surprising. Formal models of bureaucratic policymaking suggest that policymakers should be most affected by surprising information. Policymakers may be more likely to expect campaigns from public interest groups and even have prior beliefs that the public is on their side. A large segment of the public voicing support for a cause that bureaucrats perceived as narrow may be more likely to make them question or revise their prior beliefs about the public or the politics of their proposed policy.
Even among private interest groups and businesses, however, I find mixed evidence that public pressure campaigns increase lobbying success. There are several possible explanations for this result. For example, it may be that agencies may not be persuaded by political information, either because of the institutions for dealing with public input or decisionmakers’ biases. Alternatively, the relatively small sample may simply lack the power to reliably estimate small effects.
I do find evidence that public pressure campaigns coalitions mobilize support from members of Congress and reduce overt opposition by members of Congress. However, legislators disproportionately align with private interest coalitions (i.e., coalitions led by business interests), not the public interest coalitions that run most public pressure campaigns.
3.3.1.3 Comments from Legislators
One mechanism by which campaigns may influence policy is by mobilizing members of Congress. Thus, I identify comments submitted by members of Congress and count the number of legislators in each lobbying coalition. Figure 3.4 shows the number of comments from members of Congress received during rulemaking by a sample of federal agencies. There is massive variation in the level of attention that members of Congress pay to different agencies and rules. The spikes in attention to each agency correspond with public pressure campaigns targeting rules from that agency. Oversight letters are frequently co-signed by multiple members from the Senate, House, or both chambers. Some of the rules on which members of Congress commented appear in the hand-coded sample. Table 3.6 shows the number of comments from the most common types of elected officials in the hand-coded data. Members of the U.S. House and Senate are the most common.
Figure 3.4: Number of Rulemaking Comments from Members of Congress per Year, 2005-2020 to the Bureau of Ocean Energy Management (BOEM), Consumer Financial Protection Bureau (CFPB), Department of Education (ED), Office of Energy Efficiency and Renewable Energy (EERE), Federal Aviation Administration (FAA), Fish and Wildlife Service (FWS), Office of the Comptroller of the Currency (OCC), Occupational Safety and Health Administration (OSHA), Social Security Administration (SSA), U.S. Trade Representative (USTR)