D Supplementary Figures
D.1 The Number of Comments Per Rule Over Time
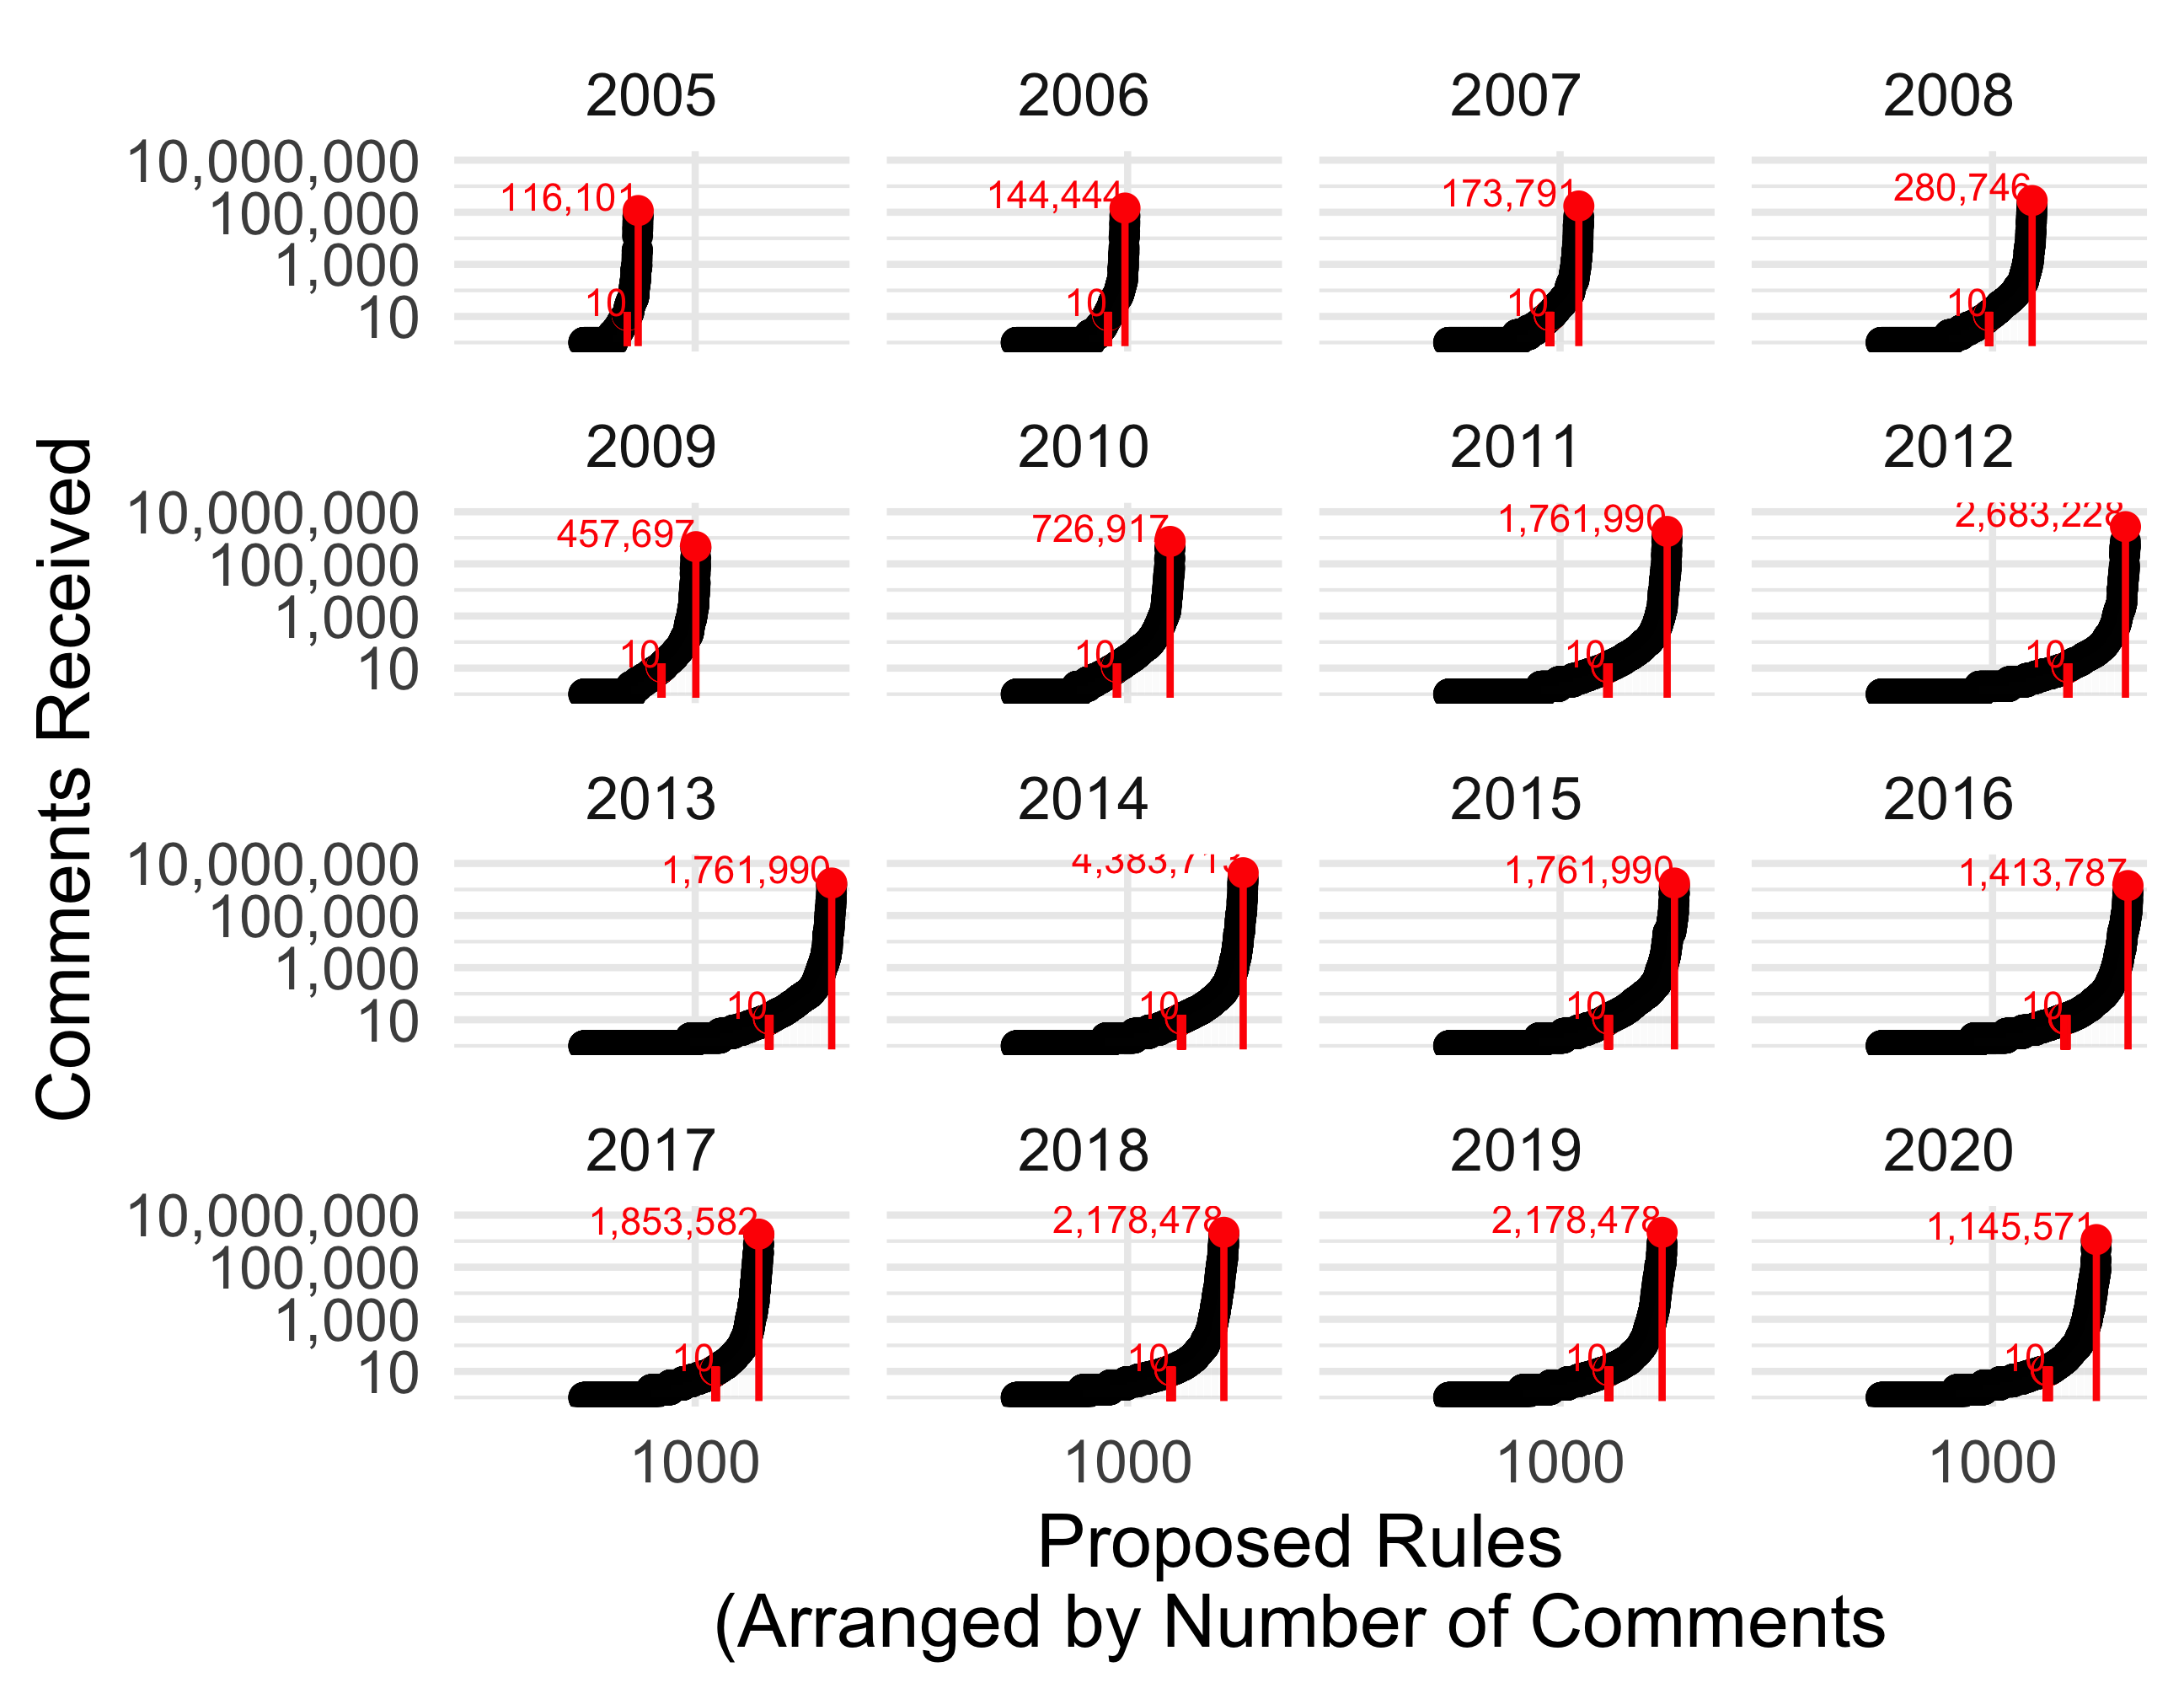
Figure D.1: Number of Comments (log scale) per Proposed Rule 2005-2020
As discussed in Chapter 2, the number of agency rules receiving a large number of public comments has increased over time. Figure D.1 breaks out the data presented in Figure 2.7 by year. Red numbers show the number of comments received on the proposed rule with the most comments (the one furthest to the right) for each year. For reference, a rule with ten comments is also marked, showing that in every year from 2005 to 2020, the majority of proposed rules open for comment on regulations.gov received less than ten comments.
D.2 Mentions of Support and Opposition
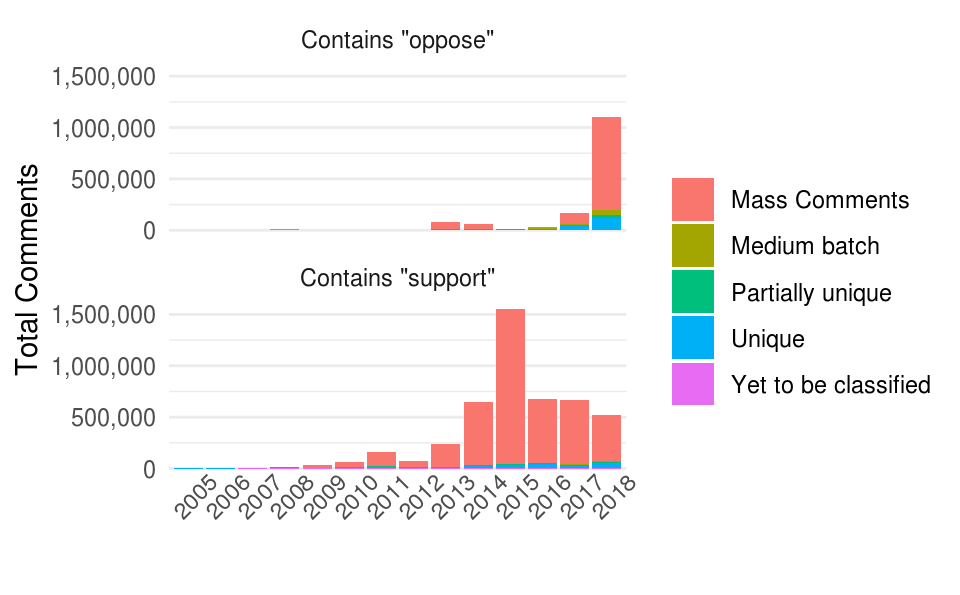
Figure D.2: Comments Containing Support" orOppose" on Draft Rules Posted to Regulations.gov, 2006-2018
In line with findings from the hand-coded data presented Figure 2.15 in 2.4, a search for “Support” and “Oppose” in comment text (Figure D.2) shows a dramatic reversal in support and opposition with the change from the Obama administration to the Trump administration. Mentions of “support” or “oppose” may be a noisy signal—these words are not used in all comments and do not always indicate support for or opposition to a rule. Still, given the partisan asymmetry in the mobilizing groups, it is plausible that this pattern is a result of the changing regulatory agenda due to the change in the presidential administration.